
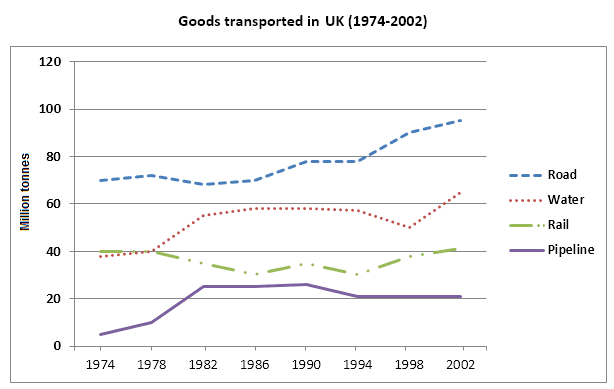
The graph, which depicts great detail, provides information about the total quantity of selected materials that were delivered inside the UK between the
years
1974 and 2002.
Use synonyms
Overall
, the road is demonstrated to be the most transported goods in Great Britain, experimenting with significant uprisings over the Linking Words
years
. Contrarily, pipelines, which equally register a wrought, were not traded as much during the established period of time.
Undoubtedly, the road is the stock with the highest quota Use synonyms
at the end
of the period. Indeed, it started with a total of 70 million tons in the 70s, only to end up with nearly 100 in the first Linking Words
years
of the 20th century. Use synonyms
While
there is an undeniable boost for some of the goods, others do represent a more modest acceleration. Linking Words
For instance
, pipelines only grow from almost 10 to 20 allotments in the course of 18 Linking Words
years
. Use synonyms
Also
, rail is the only example of a downtrend in the depiction.
Linking Words
To sum up
, the trading of specific goods in the UK kept on rising over time. Linking Words
Nevertheless
, each one experiments Linking Words
this
change in a different manner.Linking Words