
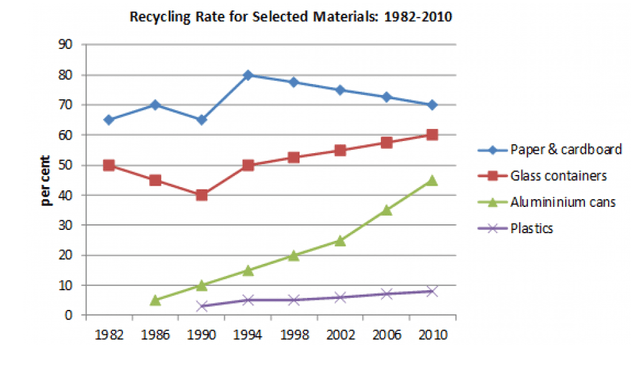
The line chart illustrates how much of certain
materials
were recycled from 1982 to 2010 in an unspecified country.
Use synonyms
Overall
, paper and cardboard, Linking Words
along with
glass containers, were the first two Linking Words
materials
to be recycled, starting in the year 1982, Use synonyms
in contrast
to aluminium cans and plastics that started approximately 4 and 8 years later, respectively. The first two Linking Words
materials
to be recycled fluctuated throughout the given period in comparison to aluminium cans which steadily increased and plastics plateaued.
Paper and cardboard were the most recycled Use synonyms
materials
, with approximately a 65% recycling rate. Later on, it fluctuated and experienced a drop in 2010. Use synonyms
On the other hand
, glass containers represented a 50% recycling rate as a starting point, Linking Words
then
had a decrease of 10% during an 8-year period, and ultimately plateaued in the final decades.
Since the start of recycling aluminium cans in 1986, its recycling average kept growing throughout the decades, finishing with around a 45% recycling rate. Linking Words
On the contrary
, plastics recycling has not had a significant change, representing only around 8 to 9% between 1990 and 2010.Linking Words