
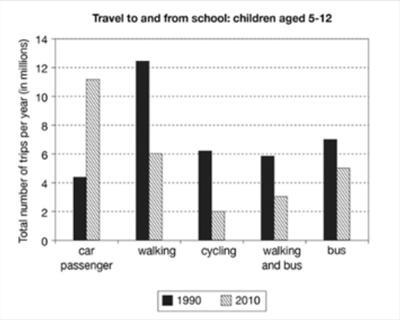
The provided bar chart depicts the amount of trips and the modes of transportation of children in 1990 and 2010. By
analysis
the visual, one can draw some observations on the mobility pattern of children aged 5 to 12 during the two years.
Interestingly, in 1990, walking to school Replace the word
analysing
predominently
outweighed other transportation methods, Correct your spelling
predominantly
such
as cycling and practising a hybrid mode of walking and Linking Words
bus
, by almost Use synonyms
a
double (12 Correct article usage
apply
millions
trips). Change to singular
million
Meanwhile
students leaned more towards going to school by Add a comma
Meanwhile,
bus
than Use synonyms
private
vehicle, in which Add an article
a private
the private
bus
ranked Use synonyms
the
second after walking Correct article usage
apply
during
1990.
Change preposition
in
In contrast
, youngsters relied most heavily on cars Linking Words
while
the least on biking in 2010. Meanwhile, walking was still preferred after motor vehicles, followed by Linking Words
bus
, and Use synonyms
then
the hybrid mode. Linking Words
Nonetheless
, as compared to 1990, the tendency to go on foot dropped by 50%. At the same time, the frequency Linking Words
as
being a car passenger Change preposition
of
had
demonstrated a drastic Unnecessary verb
apply
increased
by Replace the word
increase
two-third
in 2010 than 1990.
In conclusion, the chart has showcased the transformation of how students navigated to school by comparing 1990 and 2010 situations. The closer to the future, the more prioritization was on Correct your spelling
two-thirds
the
motor vehicles. Yet, walking was still welcomed by students regardless of time.Correct article usage
apply