
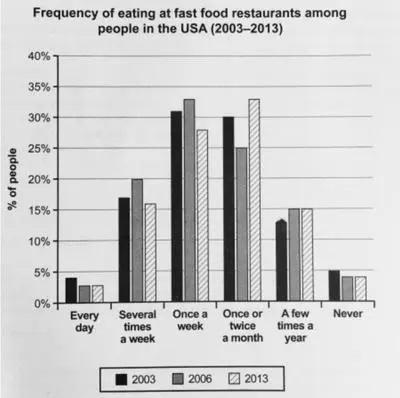
The bar chart compares the information about the
percentage
of Use synonyms
people
who visited fast Use synonyms
food
Use synonyms
Use synonyms
restraunts
with different frequency in 3 various Correct your spelling
restaurants
years
. Use synonyms
Overall
, the Linking Words
percentage
of Use synonyms
people
who Use synonyms
prefered
to go to fast Correct your spelling
preferred
food
restaurants every Use synonyms
day
amounted to less than 5 %, Use synonyms
whereas
the Linking Words
percentage
of Use synonyms
people
who ate in the same type of Use synonyms
Use synonyms
restraunts
once a Correct your spelling
restaurants
week
was more than 25% in all three Use synonyms
years
.
It can be seen thatUse synonyms
,
the lowest Remove the comma
apply
percentage
of Use synonyms
people
visiting fast Use synonyms
food
Use synonyms
Use synonyms
restraunts
over the given period was for those who went there every Correct your spelling
restaurants
day
and for those who never went there. In 2003, those who ate fast Use synonyms
food
every Use synonyms
day
amounted to 4%, Use synonyms
whereas
those who never ate in fast Linking Words
food
Use synonyms
Use synonyms
restraunts
comprised 5%. In the remained Correct your spelling
restaurants
years
, the Use synonyms
percentage
of junk Use synonyms
food
Use synonyms
Use synonyms
restraunts
’ Correct your spelling
restaurants
every
Correct your spelling
everyday
day
visitors was approximately 3%, Use synonyms
however
, the Linking Words
number
of Use synonyms
people
who never visited the same type of Use synonyms
Use synonyms
restraunts
was higher Correct your spelling
restaurants
for
1%.
The highest Change preposition
by
percentage
of Use synonyms
people
who visited fast Use synonyms
food
Use synonyms
Use synonyms
restraunts
several times a Correct your spelling
restaurants
week
amounted to 20% in the year 2006. 7 Use synonyms
years
later, the Use synonyms
number
of fast Use synonyms
food
consumers declined by about 4%. In 2003, those who consumed fast Use synonyms
food
with a frequency of a few times a year was around 13%, Use synonyms
however
, 3 and Linking Words
then
7 Linking Words
years
later, Use synonyms
indicator
of consumers increased to 15%.
31% of Correct article usage
the indicator
people
ate fast Use synonyms
food
once a Use synonyms
week
in 2003. After 3 Use synonyms
years
, Use synonyms
this
indicator slightly increased and Linking Words
then
by 2013 decreased to around 27%. The Linking Words
number
of those who preferred to visit fast Use synonyms
food
Use synonyms
Use synonyms
restraunts
once or twice a month in 2003 was almost similar Correct your spelling
restaurants
with
those who visited once a Change preposition
to
week
in the same year. Use synonyms
In contrast
, the Linking Words
number
of those who ate fast Use synonyms
food
once or twice a month in 2006 was lower than Use synonyms
of
those who ate Correct pronoun usage
that of
such
Linking Words
food
in 2013.Use synonyms