
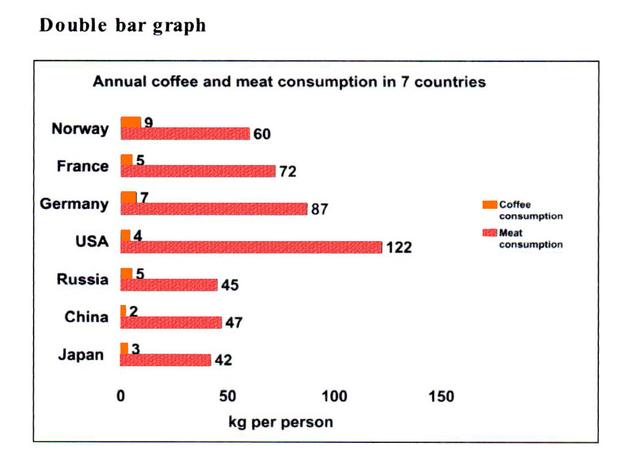
The given horizontal bar chart compares the number of
coffee
and Use synonyms
meat
consumed in certain Use synonyms
countries
Use synonyms
Overall
, obviously from the diagram the USA is the biggest consumer of Linking Words
meat
Use synonyms
whereas
Linking Words
Norway
is the largest customer of Use synonyms
coffee
. Use synonyms
By contrast
, in Asian Linking Words
countries
, both products are consumed the least.
It is clear from the data that 122 Use synonyms
kg
per Use synonyms
person
Use synonyms
meat
consumption was recorded in the USA and it is the highest indicator among all Use synonyms
countries
. Next, Use synonyms
meat
-eating is in European states Use synonyms
such
as Germany, France and Linking Words
Norway
with 87, 72 and 60 kilograms per Use synonyms
person
. The remaining Use synonyms
countries
(China, Russia and Japan) have a value in the range of 42 to 47 Use synonyms
kg
on a citizen. Of all given Use synonyms
countries
China has the lowest index of Use synonyms
meat
eating.
In comparison to Use synonyms
meat
, Use synonyms
coffee
has low values in all Use synonyms
countries
in the chart and the highest of them is 9 Use synonyms
kg
per Use synonyms
person
in Use synonyms
Norway
. Use synonyms
However
, Germany is not too far and their Linking Words
coffee
use amounts to 7kg per Use synonyms
person
. Similar figures in France and Russia are equal to 5kg of citizens. Use synonyms
Moreover
, the US rate is just below 1 Linking Words
kg
. The Use synonyms
countries
with the smallest kilogramms per Use synonyms
person
are Japan and China. Their score is almost thrice lower than Use synonyms
Norway
's values (2kg and 3 Use synonyms
kg
per Use synonyms
person
).Use synonyms