
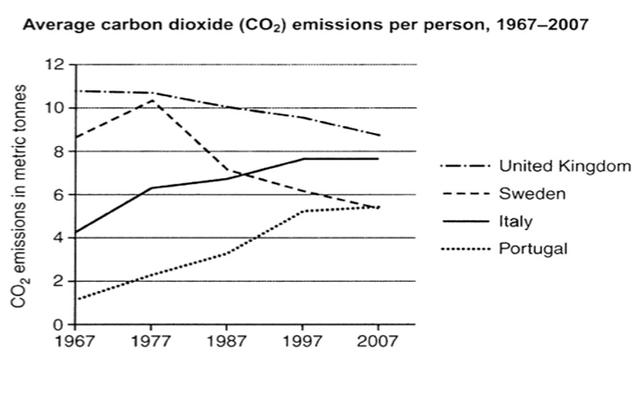
The chart presents the average CO2
emissions
per Use synonyms
person
in four European nations from 1967 to 2007.
Use synonyms
Overall
, average CO2 Linking Words
emissions
of individuals in the UK and Sweden generally dropped, Use synonyms
whereas
Linking Words
emissions
per Use synonyms
person
in Italy and Portugal rose significantly. Despite the steady reduction, average Use synonyms
emissions
in the UK were the highest in the given period.
Among the selected countries, the CO2 Use synonyms
emissions
per Use synonyms
person
in the UK were the highest throughout the four decades, yet said Use synonyms
emissions
were on the decline. In 1967, the average Use synonyms
emissions
per Use synonyms
person
were nearly 11 metric Use synonyms
tonnes
. But by 2007, that had fallen to roughly 9 metric Use synonyms
tonnes
. Somewhat Use synonyms
similarly
, the average CO2 Linking Words
emissions
in Sweden were almost 9 metric Use synonyms
tonnes
per Use synonyms
person
in 1967. The Use synonyms
emissions
spiked,Use synonyms
however
, to nearly 11 metric Linking Words
tonnes
in 1977 though from there, Use synonyms
emissions
continuously fell, dropping to just 5.5 metric Use synonyms
tonnes
in 2007.
Use synonyms
Conversely
, both Italy's and Portugal's carbon dioxide Linking Words
emissions
per Use synonyms
person
increased between 1967 and 2007. Italy's CO2 Use synonyms
emissions
nearly doubled, starting at just above 4 metric Use synonyms
tonnes
in 1967 and ending at almost 8 metric Use synonyms
tonnes
four decades later. Portugal's CO2 Use synonyms
emissions
, Use synonyms
however
, nearly quadrupled. The per capita average in 1967 was just 1.5 metric Linking Words
tonnes
. But in 2007, the Use synonyms
emissions
had reached 5.5 metric Use synonyms
tonnes
, matching Sweden's average.Use synonyms