
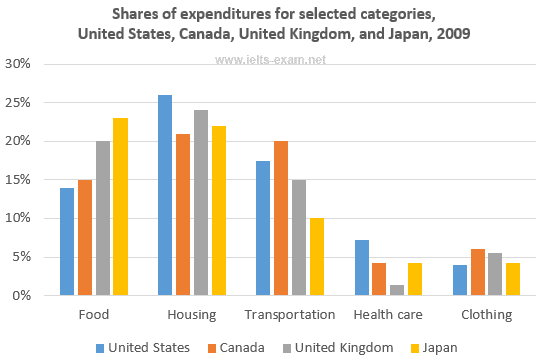
The bar chart compares the US, Canada, the
UK
, and Japan in terms of their spending in five essential categories, including Use synonyms
food
, housing, Use synonyms
transportation
, health care and clothing, in 2009.
Use synonyms
Overall
, what stands out from the graph is that the cost of housing in the US was the highest during the period shown on the chart. Another striking feature is the increase in Linking Words
food
spending across four countries, Use synonyms
conversely
, housing and healthcare expenditures dropped slightly.
In 2009, residents of the United States spent most of their money on housing and Linking Words
transportation
, with around 26% and just under 18%, in comparison to Use synonyms
food
, which accounts for nearly half the percentage spent on housing, approximately 13%. Over the same period, the figure for health care and clothing took a small proportion, with around 7% and below 5% respectively. Canada witnessed a comparable trajectory to that of the US, housing, Use synonyms
transportation
, and Use synonyms
food
were the top three consumption, close to 21% , 20% , and 15% respectively. Use synonyms
By contrast
, only 6% and below 5% of money was used on buying clothes and taking care of health.
Throughout the year, the respective percentages of purchases in housing, Linking Words
food
and Use synonyms
transportation
in the Use synonyms
UK
were close to 24% , 20% , and 15%, experiencing the same situation as that of the US and Canada. By 2009, the expenditures on healthcare in the Use synonyms
UK
were the lowest compared to the other three countries, at around 2%, Use synonyms
while
the citizens in the Linking Words
UK
spent around 6 % on clothing. In Japan, most of the expenses were directed toward Use synonyms
food
and housing, both approximately 23%. Use synonyms
On the other hand
, the cost of Linking Words
transportation
, at 10%, was almost double both healthcare and clothing, standing at only 5% for each.Use synonyms