The graph below shows average carbon dioxide (CO2) emissions per person in the United Kingdom, Sweden, Italy and Portugal between 1967 and 2007

The graph below shows average carbon dioxide (CO2) emissions per person in the United Kingdom, Sweden, Italy and Portugal between 1967 and 2007
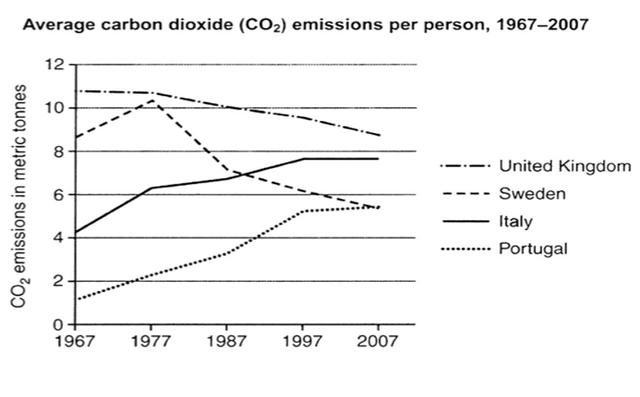
The following graph demonstrates how much each person discharges carbon dioxide on average in the United Kingdom, Sweden, Italy and Portugal in the 40-year period, between 1967 and 2007. As a whole, The United Kingdom tops the graph despite its decreasing trend. The second one on top is Sweden which has some fluctuations. Italy and Portugal had low emissions but their trend is rising. The United Kingdom’s amount of carbon dioxide production was more than 10
tonnes
in 1967, and it dropped steadily through the years, and at
last
reached about 9 metric
tonnes
, in 2007. Sweden’s procedure was not stable. It started out with more than 8
tonnes
in 1967 and reached its peak in 1977 with more than 10
tonnes
.
Then
, the rate fell sharply to less than 8
tonnes
in 1987, and the decrease continued gradually till 2007. Italy’s amount was more than 4
tonnes
in 1967 and rose steadily and got to its summit in 2007. The lowest amount belongs to Portugal with less than 2metric
tonnes
in 1967 and more than 4
tonnes
in 2007, which in
this
year coincides with Sweden.
Submitted by mehrasa.elahian on

Unauthorized use and/or duplication of this material without express and written permission from this site’s author and/or owner is strictly prohibited. Excerpts and links may be used, provided that full and clear credit is given to Writing9 with appropriate and specific direction to the original content.

Sentences: Add more complex sentences.
Introduction: The introduction is missing.
Introduction: Change the first sentence in the introduction.
Introduction: The chart intro is missing.
Vocabulary: Rephrase your introduction. Words match: 79%.
Vocabulary: Replace the words tonnes with synonyms.
Vocabulary: Rephrase the word "undefined" in your introduction.
Vocabulary: The word "graph" was used 2 times.
Vocabulary: The word "amount" was used 3 times.
Vocabulary: The word "trend" was used 2 times.
Vocabulary: The word "reached" was used 2 times.
Topic Vocabulary:
  • carbon dioxide emissions
  • per person
  • United Kingdom
  • Sweden
  • Italy
  • Portugal
  • graph
  • compare
  • average
  • increase
  • decrease
  • trend
  • peak
  • decline
  • years
  • period
What to do next:
Look at other essays: