
The bar chart illustrates the average weekly money used by families in the
year
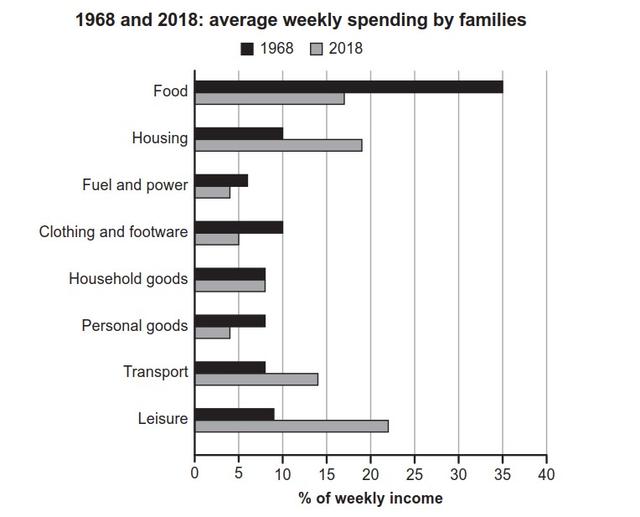
1968 and 2018.
Looking from Fix the agreement mistake
years
Linking Words
overall
perspective, it is readily apparent that most of Add an article
an overall
the overall
spending
Add an article
the spending
was
dropped, Unnecessary verb
apply
while
the remaining Linking Words
were
rose. The difference in Unnecessary verb
apply
amount
of spending varied most in food, Add an article
the amount
while
household goods remained unchanged.
In 1968, food was spent most with 35% of families income before Linking Words
dropped
to above 15% in 2018. Wrong verb form
dropping
While
fuel and power were the lowest spend with above 5% and decrease to below 5% in the next 50 years. Personal goods (over 5%), and fuel and power (nearly 5%) Linking Words
were
declined to below 5%Unnecessary verb
apply
both
.
Correct pronoun usage
apply
However
, 10% of housing Linking Words
were
spent in 1968 which was half used in 2018. In terms of transport and Correct subject-verb agreement
was
leisure
both were just below 10% and Add a comma
leisure,
then
rose to approximately 15% and more than 20%, respectively in 2018. Linking Words
In
the other hand, household goods were unaltered at just above 5%.Change preposition
On