
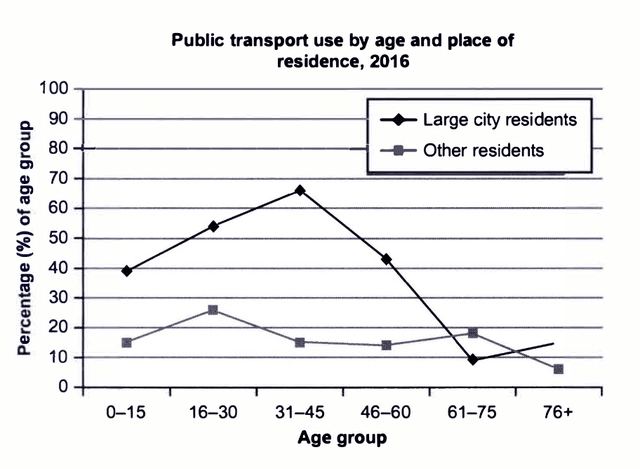
The line graph illustrates the number of people, who used public transport for different
age
groups and types of Use synonyms
cities
in 2016.
Use synonyms
Overall
, it is obvious that the proportion of people’s usage of public transportation in big Linking Words
cities
was higher in all Use synonyms
age
groupsUse synonyms
,
than in small Remove the comma
apply
cities
, except for residents between 61 and 75 years.
The percentage of individuals of the Use synonyms
age
group under 15, who used public transport, was at approximately 40 %.But, it began to increase significantly when civilians started to get older and it reached the highest point of almost 65 % in the Use synonyms
age
from 31 to 45.Use synonyms
However
, the figure began to drop sharply and fell to the lowest point of around 10 % in the Linking Words
age
group between 61 and 75.The group of people, who are more than 76 years old, showed a slight rise to just over 10 %.
The index of other Use synonyms
cities
fluctuated slightly over the given period by 20 % (from 25 % to 5%).Use synonyms