
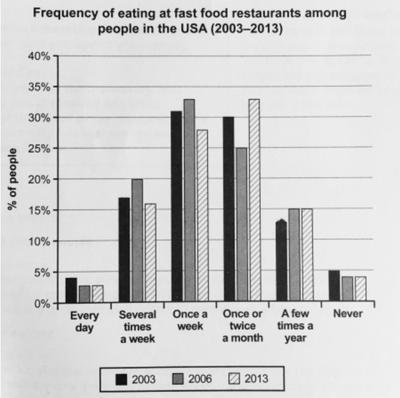
The bar chart illustrates how often individuals in America had their meals in fast
food
Use synonyms
restaurants
over the period between 2003 and 2013.
Use synonyms
Overall
, it can be seen that for a decade, the majority of people ate Linking Words
this
kind of unhealthy Linking Words
food
in diners in moderate quantities Use synonyms
such
as once a week, or even one or two times a month. The two extremes, never and every day, were the least popular among the population.
In 2003 around 31% of the consumers ate fast Linking Words
food
once a week. A tendency, which slightly increased in 2006 to 33% and Use synonyms
then
declined again to approximately 27% in 2013. Exactly 30% of the population ate in those types of Linking Words
restaurants
one or two times a month in the year 2003, followed by a decrease in 2006 (25%) and Use synonyms
then
a rise to 33%.
Only about 4% of the individuals in 2003 ate in quick service Linking Words
restaurants
every day. Use synonyms
Moreover
, Linking Words
this
proportion declined to 3% in both of the other years. The same happened with the proportion of persons who didn't eat fast Linking Words
food
in Use synonyms
restaurants
at all with 5% in 2003 to 4% in 2006 and 2013.Use synonyms