
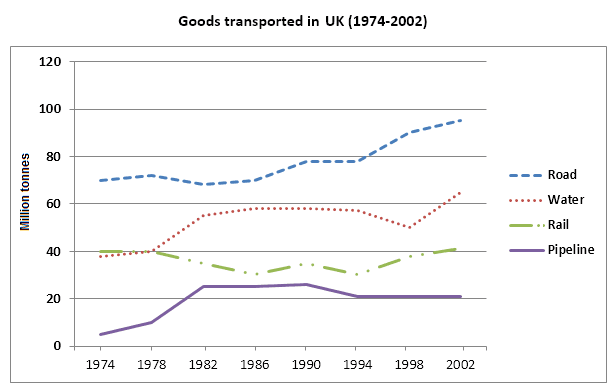
The line graph illustrates the weight of goods transported by four major modes of transport around the UK in a 28-year period starting in 1974.
Overall
, most of the modes show a rise in total except the Rali which stays the same relatively. The Pipeline started near zero and rocketed to peak in 1982 and kept that until the end of the period. Water and Rail started at nearly the same point but the Water rose despite the Rail that fluctuated around the same amount.
From 1978 to 1982 two of them jumped and two of them fell the most significant jump refers to the Water which climaxed nearly 20 Linking Words
million
Use synonyms
tonnes
of goods Use synonyms
also
in the same amount of time the Rail lost one quarter and carried around 30 Linking Words
million
Use synonyms
tonnes
.
The Road has the most different act Use synonyms
due to
others which is the most common one and keep that honour during that years by showing nice and smooth growth that started with above 70 Linking Words
million
Use synonyms
tonnes
in 1974 and end near 100 Use synonyms
million
Use synonyms
tonnes
in 2002 that means the Road carries as five-time as Pipeline at the same time.Use synonyms