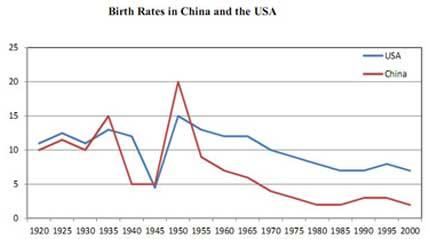
The graph below compares changes in the birth rates of China and the USA between 1920 and 2000. Summarise the information by selecting and reporting the main features, and make comparisons where relevant.

This
graph depicts changes in the Linking Words
birth
rates Use synonyms
of
China and the
USA by 80 Change preposition
in
years
.
Use synonyms
Overall
, a glimpse of the figure provides some striking similarities between these 2 countries’ Linking Words
birth
rates. There is no doubt that Use synonyms
natality
of both countries fluctuated significantly, with lows in the 1940s and highs during the 1950s.
From 1935 to 1940, the USA witnessed a negligible decline, Correct article usage
the natality
then
more sharply in the next 5 Linking Words
years
to hit its lowest point, at 5% in 1945. After that, in 5 Use synonyms
years
, the Use synonyms
birth
Use synonyms
rate
showed a quick climb from 5% to the peak, Use synonyms
at
10%. The fertility Change preposition
of
rate
underwent a gradual decrease to 6% Use synonyms
at the end
of the observed period.
The Linking Words
birth
Use synonyms
rate
in China fluctuated rapidly, Use synonyms
becore
increased Correct your spelling
before
become
10
% Change preposition
by 10
reached
a high of 20% in 1950. The figure Correct word choice
and reached
declinded
sharply to 8% after 5 Correct your spelling
declined
years
. From 1955 to 2000, the fertility Use synonyms
rate
saw a Use synonyms
slowly
decrease from 8% to 2%.Change the word
slow
Submitted by cathyngo1512 on
Unauthorized use and/or duplication of this material without express and written permission from this site’s author and/or owner is strictly prohibited. Excerpts and links may be used, provided that full and clear credit is given to Writing9 with appropriate and specific direction to the original content.
Sentences: Add more complex sentences.
▼
Vocabulary: Replace the words birth, years, rate with synonyms.
▼
Vocabulary: Rephrase the word "changes" in your introduction.
▼
Vocabulary: The word "figure" was used 2 times.
▼
Vocabulary: The word "decrease" was used 2 times.
▼
Vocabulary: The word "fluctuated" was used 2 times.
▼
Vocabulary: Use several vocabularies to present the data in the second paragraph.
▼