
Given is a graph indicating some information regarding the
develop
in the community in some of the world’s huge cities Replace the word
development
as well as
the Linking Words
population
giving out in built-up and countryside Use synonyms
Use synonyms
area
including Fix the agreement mistake
areas
Tokyo
, New Use synonyms
York
, Shanghai, Bambara, and Jakarta over a period of sixteen years. The growth in the Use synonyms
population
is measured in Use synonyms
million
(Fix the agreement mistake
millions
M
).
Use synonyms
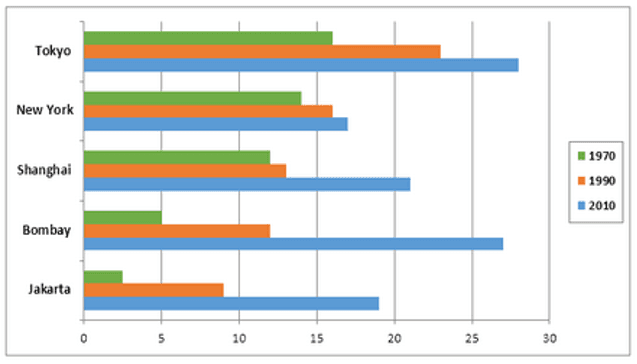
Overall
, the Linking Words
population
number of all five communities increased, albeit to a widely varying degree, Use synonyms
Tokyo
witnessed a higher rise during 2010. New Use synonyms
York
experienced Use synonyms
a
least rise during a given period.
Change the article
the
According to
the bar graph, Linking Words
Use synonyms
Tokyo
Change noun form
Tokyo's
population
increased from 17 (Use synonyms
M
) to 24 (Use synonyms
M
) between 1970 and 1990 and the Use synonyms
population
in Use synonyms
Tokyo
increased to 27.6 (Use synonyms
M
) in 2010. New Use synonyms
York
increased from 12.5 to 26.6 (Use synonyms
M
) between 1950 to 2010. Use synonyms
Shanghai
Change noun form
Shanghai's
population
witnessed an increase from 22.9 (Use synonyms
M
).
Use synonyms
Although
Bombay didn’t show that much increase during 1970 and 1990 Linking Words
but
increasing from 22 in 1990 to 26.6 in 2010, Correct word choice
apply
Bombay
community witnessed an increase from 4.6 (Correct article usage
the Bombay
M
) until 2010. The Use synonyms
population
growth in Bombay and Jakarta, almost 5.5 times, was higher than any other city listed.
The table data shows that in 1950 the most polluted city in the world was New Use synonyms
York
with 12.5 (Use synonyms
M
) residents. London is in 2nd grade with 7.9 (Use synonyms
M
) residents and Use synonyms
Tokyo
is in third grade with 6.5(Use synonyms
M
).The figure for Paris and Moscow remained fairly stable during Use synonyms
1950
period.
Correct article usage
the 1950
Linking Words
At
the end, over than 3 billion people lived in Change the preposition
In
a
rural Correct article usage
apply
Use synonyms
area
Fix the agreement mistake
areas
during
1980 to 1990 Change preposition
from
while
less than 2 billion people lived in urban Linking Words
Use synonyms
area
. But between 2000 to 2010 Fix the agreement mistake
areas
population
of people in the urban Use synonyms
area
increased from 2.5 (B) to 4(B) and the rural Use synonyms
population
decreased from almost 0.5 billion Use synonyms
during
2000 to 2010.Change preposition
from