
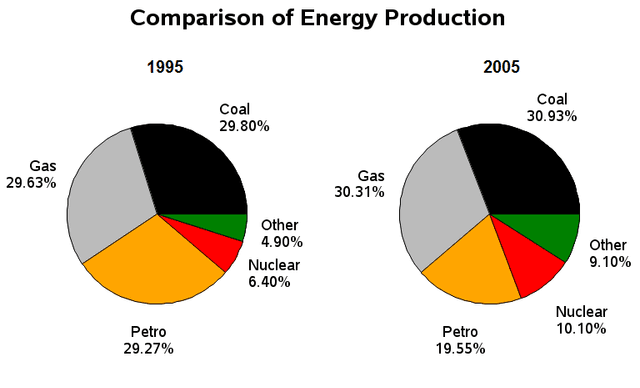
The pie charts compare the amount of
energy
produced in a specific country in 2 different years, 1995 and 2005.
Use synonyms
Overall
,
Coal production experienced the highest proportion in those 2 years, Linking Words
while
nuclear Linking Words
energy
in 2005 and the category labelled as other in 1995 ranked Use synonyms
last
.
Linking Words
To begin
, the figure for coal Linking Words
energy
was the highest in 1995 and 2005, approximately 30 Use synonyms
Use synonyms
percent
. The proportion of gas Change the spelling
per cent
energy
that have been produced in those 2 years, stood Use synonyms
second,
well under 30 Linking Words
percent
in 1995 and well over 30 Use synonyms
percent
in 2005.
Petro production accounted for just over 29 Use synonyms
Use synonyms
percent
in the year Change the spelling
per cent
of
1995. Change preposition
apply
By contrast
the figure for petro Linking Words
energy
in 2005 was lower at nearly 19.5 Use synonyms
percent
. The proportion of nuclear Use synonyms
energy
in 2005 was higher at just over 10 % Use synonyms
by comparison
. The remaining amount of Linking Words
energy
was approximately 5 in 1995, Use synonyms
whereas
in 2005 it saw a percentage of nearly 10 Linking Words
Use synonyms
percent
.Change the spelling
per cent