
The chart illustrates
total
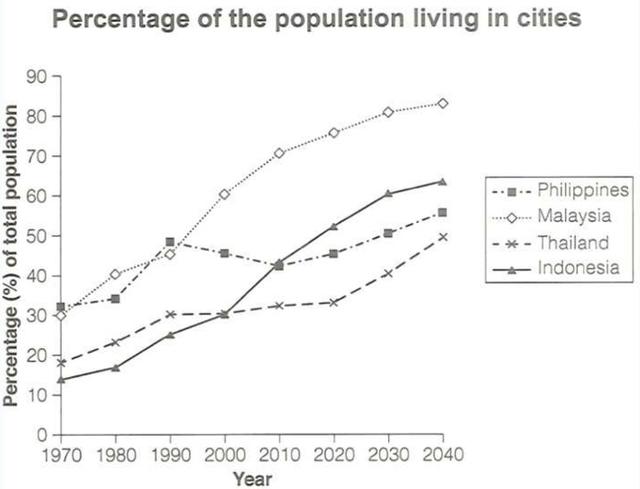
number of citizens, which is expressed in percentages, living in four cities between 1970 and 2020 and the future estimates for 2030 and 2040.
Change the article
a total
the total
Overall
,it is expected that more people would live in these countries in the next two decades as compared to the earlier years with the total population in Malaysia exceeding all the other nations Linking Words
at the end
of the estimated period.
Linking Words
Although
Linking Words
,
there were more individuals in the Philippines than in Malaysia at the start , which was in 1970, at around 32% and 30% respectively,after 1990, more humans lived in the latter and by the end of 2040 it should be expected that the amount would be twice that in the former at around 50% and 80% respectively.
As for the other countries, Remove the comma
apply
with
Thailand Change preposition
apply
recording
higher than Indonesia (around 18% and 12% respectively), in 1970, after 2000 when they both recorded Wrong verb form
recorded
similar
number of inhabitants: around 25%, by the end of 2040, it is predicted that majority will dwell in Indonesia than the former at around 60%.Change the article
a similar
the similar