
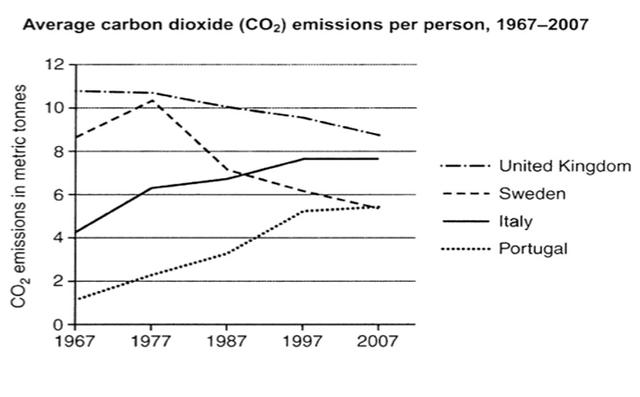
The supplied line graph represents the emissions of carbon dioxide (CO2) per
person
in four different nations (the United Use synonyms
Kingdom
, Sweden, Italy and Portugal) which were emitted for over four decades from 1967 and 2007. Units are measured in metric Use synonyms
tonnes
.
Use synonyms
Overall
,the emissions of CO2 per Linking Words
person
in the United Use synonyms
Kingdom
and Sweden decreased over the period given, Use synonyms
while
for Italy and Portugal, they rose. Linking Words
Moreover
, the United Linking Words
Kingdom
had the highest rate of CO2 emissions throughout.
With regard to the amount of CO2 emitted per Use synonyms
person
in the United Use synonyms
Kingdom
, it began from more than 10 metric Use synonyms
tonnes
in 1967 and Use synonyms
then
declined to nearly 8 metric Linking Words
tonnes
in 2007. Use synonyms
Likewise
, the average rate of CO2 produced per Linking Words
person
in Sweden started from just over 8 metric Use synonyms
tonnes
in 1967 Use synonyms
then
peaked at a little less than 6 metric Linking Words
tonnes
in 1977, and Use synonyms
then
it is obvious that it went down to a little less than 6 metric Linking Words
tonnes
Use synonyms
at the end
of the period.
Linking Words
On the other hand
, it is obvious that the amount of CO2 emitted per Linking Words
person
in Italy increased from a little more than 4 metric Use synonyms
tonnes
in 1967 to almost 8 metric Use synonyms
tonnes
in 2007. Use synonyms
Similarly
, the average rate of CO2 emitted per Linking Words
person
in Portugal surged from less than 2 metric Use synonyms
tonnes
in 1967 to Use synonyms
reach
almost 6 metric Verb problem
apply
tonnes
in the final year.Use synonyms