
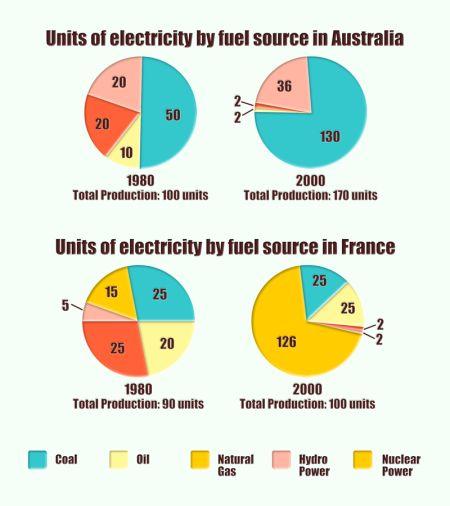
The pie charts compare the quantities of
electricity
fueled by different types of resources between Australia and France in the years 1980 and 2000.
It is obvious that the Use synonyms
electricity
production of the two nations witnessed significant growth over the period shown, in which coal played an increasing role in Australia, Use synonyms
whereas
nuclear power accounted for the majority of producing Linking Words
electricity
in France two decades later.
In 1980, half of Use synonyms
electricity
was generated by coal, which rose to more than three quarters after 20 years, at 130 Use synonyms
units
. The trend was the same for hydropower, and the figure approximately doubled, increasing to 36 Use synonyms
units
. Use synonyms
By contrast
, there was a sharp decline in generating Linking Words
electricity
by oil and natural gas, which became almost negligible, and there was no data recorded for nuclear power.
The amount of Use synonyms
electricity
powered by nuclear grew significantly with the figure rising from 15 to 126 Use synonyms
units
over the 20-year period in the European country, which outnumbered twofold of the rest of the sources combined. The Use synonyms
units
of Use synonyms
electricity
produced by coal (25 Use synonyms
units
in 1980) and oil (20 Use synonyms
units
in 1980) nearly remained unchanged, at 25 Use synonyms
units
respectively in 2000, Use synonyms
whereas
the proportions in the Linking Words
overall
production were losing in popularity. Linking Words
However
, the quantities of Linking Words
electricity
supplied by natural gas and hydropower were only 2 Use synonyms
units
respectively, in 2000 showing a marked decrease of 23 and 3 Use synonyms
units
compared with the previous year’s figures.Use synonyms