The chart below shows the different level of post-school qualifications in Australia and the proportion of men and women who held them in 1999.

The chart below shows the different level of post-school qualifications in Australia and the proportion of men and women who held them in 1999.
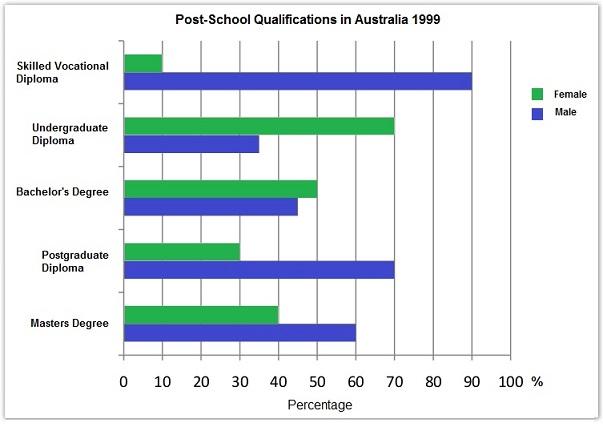
The bar chart represents information about the education level in Australia between males and females in the year 1999.
Overall
,it can be seen that men had the certificate of skilled worker diploma, postgraduate and masters degree more than women.
In contrast
, the highest of undergraduate
diploma
Fix the agreement mistake
diplomas
show examples
and bachelor's
degree
Fix the agreement mistake
degrees
show examples
were women.
To begin
with,
Submitted by itchayatop31 on

Unauthorized use and/or duplication of this material without express and written permission from this site’s author and/or owner is strictly prohibited. Excerpts and links may be used, provided that full and clear credit is given to Writing9 with appropriate and specific direction to the original content.

Basic structure: Add more body paragraphs.
Common mistake: Your writing should be 150-250 words.
Vocabulary: Only 4 basic words for charts were used.
Vocabulary: Use several vocabularies to present the data in the second paragraph.
Vocabulary: Use several vocabularies to present the data in the third paragraph.
What to do next:
Look at other essays: