
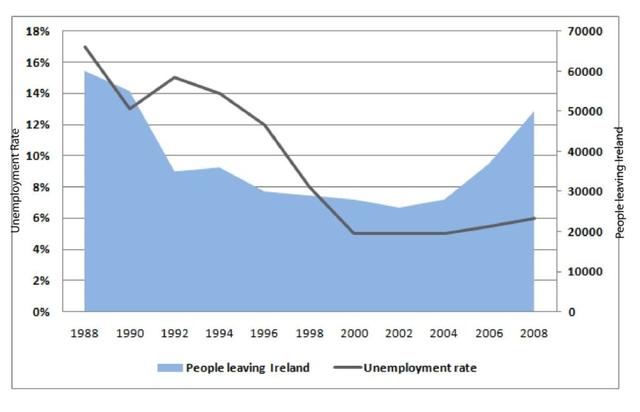
The diagram demonstrates the joblessness volume in Ireland and how many individuals left the country from 1988 to 2008
Overall
, Linking Words
it is clear that
Linking Words
although
the rate of Irish people being unemployed saw a huge decline in 10 Linking Words
years
,the number of people migrating decreased slightly.
Focusing on the proportion of joblessness in Ireland, it is noticeable that Use synonyms
although
it has been exacerbated significantly, it had several changing patterns through these ten Linking Words
years
. More specifically, the rate had 3 changing trend points in 1990, 1992 and 2000. Use synonyms
Firstly
, Linking Words
this
level witnessed a 4% decrease in the first two Linking Words
years
, reaching a proportion of 13%. Use synonyms
Secondly
, it started rising up to 15% from 1990 to 1992. Linking Words
Lastly
, it fell to approximately 5% in the year 2000, after which it started rising again and reached 6% in the Linking Words
last
year.
Moving on to the number of migrants, its significant downfall is noticeable in the first 4 Linking Words
years
to just beyond 3000. Use synonyms
Moreover
, for the next 12 Linking Words
years
, it plateaued between 4000 and 3000 and Use synonyms
then
increased to a number of 50000Linking Words