
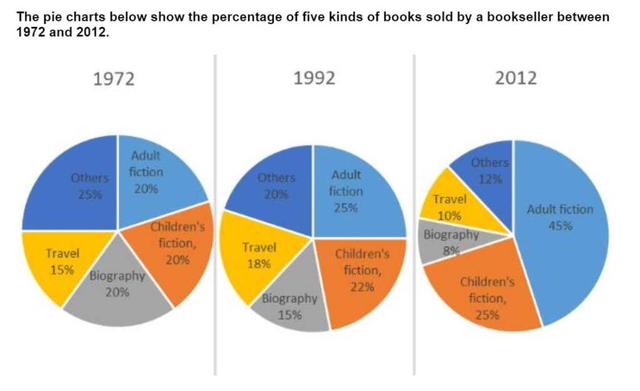
The pie chart illustrates the proportion of five book categories (
Adult
Use synonyms
fiction
, Children’s Use synonyms
fiction
, Biography, Use synonyms
Travel
, and Others) in 1972, 1992, and 2012, measured by percentage. Use synonyms
Overall
, there was a growing number of people buying Linking Words
fiction
Use synonyms
books
both Use synonyms
adult
and children’s Use synonyms
fiction
meanwhile, fewer people bought Biography Use synonyms
books
and other types of Use synonyms
books
. Use synonyms
Furthermore
, Linking Words
travel
Use synonyms
books
witnessed a fluctuating number over the years.
Regarding Use synonyms
fiction
genres, Use synonyms
Adult
Use synonyms
fiction
sales had a fifth growth from 1992 to 2012, which was a significant rise and the highest allocation among other Use synonyms
books
. Use synonyms
While
the sales of children’s storybooks had an insignificant rise compared to Linking Words
adult
Use synonyms
books
, the figure increased steadily to 25% in the final year.
Regarding the three other types of Use synonyms
books
, Use synonyms
Travel
and other Use synonyms
books
slightly declined from 1972 to 2012, with a decrease to just over a tenth in the final year. Use synonyms
On the other hand
, there was a moderate growth in Linking Words
Travel
Use synonyms
books
, starting at 15% to 18%, Use synonyms
then
the number fell to a small proportion in 2012.Linking Words