
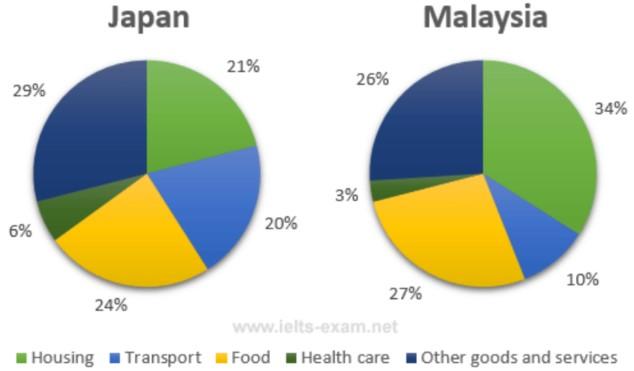
The two pie charts indicate the proportion of budget spent on
household
in Fix the agreement mistake
households
Japan
compared to Use synonyms
Malaysia
in 2010 based on five categories, namely housing, transport, food, health care and other goods and services.
Use synonyms
Overall
, all countries spent the most on housing, transport, food and other goods and services. By Linking Words
contrase
, the percentage of spending on health care was the lowest.
It can be seen from the chart that around 34% of Correct your spelling
contrast
the
Correct article usage
apply
Malaysia
’s budget was spent on housing. Use synonyms
This
figure took up over one-third of the total cost Linking Words
while
it was just over one-fifth in Japa, at 21%. Transport in Linking Words
Japan
Use synonyms
is
twice Verb problem
costs
cost
as Verb problem
apply
many
as in Correct quantifier usage
much
Malaysia
on Use synonyms
an
average.
As Correct article usage
apply
in
illustrated by the graph, food expenditure in Change preposition
apply
Malaysia
accounted for 27% was slightly higher than that of Use synonyms
Japan
Use synonyms
with
24%. In terms of different goods and services, Change preposition
at
Japan
spent Use synonyms
at
around 29% which was 3% more than that of Change preposition
apply
Malaysia
. Use synonyms
Finally
, the comparison of spending on health care doubled in Linking Words
Japan
, at 6% Use synonyms
rhan
the figure for Correct your spelling
than
Malaysia
at only 3%.Use synonyms