
The two pie charts illustrate the percentage distributions of online sales
in
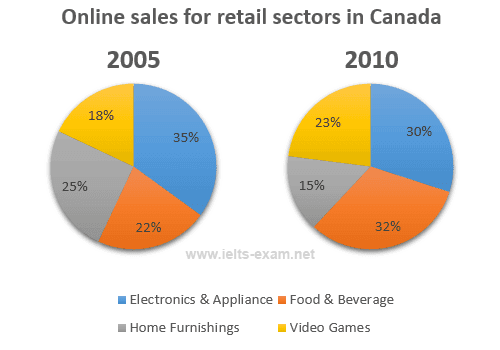
four types of products in Canada in 2005 and 2010.
Change preposition
of
Overall
, it is evident that the food/beverage and video games categories saw an increase, Linking Words
while
electronics/appliance and home furnishings witnessed a decline over the five years. In 2005, the shares of provisions and game consoles were 22% and 18%, which increased to 32% and 23% in 2010, respectively. Linking Words
Conversely
, the shares of electronic gadgets and furniture reduced by 5% and 10%, recording 30% and 15%, respectively.
Comparing the popularity of the four retail sectors among online shoppers, electronics was the most predominant, with a share of 35% in 2005, starkly contrasting with 18% of video games, which ranked at the bottom. Linking Words
However
, with the discernible changes mentioned in the above paragraph, the 2010 sales ranking was shifted; food and drinks ranked top with 30%, precisely double that of home furnishings, the least Linking Words
favored
that year.Change the spelling
favoured