The pie charts below show the average household expenditures in Japan and Malaysia in the year 2010. Summarize the information by selecting and reporting the main features, and make comparisons where relevant.

The pie charts below show the average household expenditures in Japan and Malaysia in the year 2010. Summarize the information by selecting and reporting the main features, and make comparisons where relevant.
The
given
Verb problem
apply
show examples
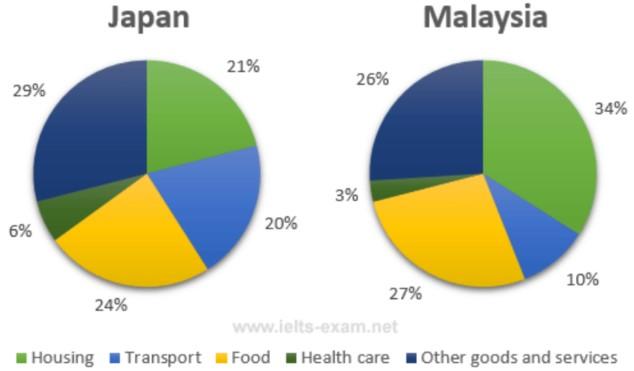
pie chart delineates what people spent money
for
Change preposition
on
show examples
in two nations in the year 2010 In general, the expenditures for housing and food were at the top in both nations
while
the opposite was true for health care. Another striking feature is that in
Malaysia
, people tended to spend their money on nutrients and living accommodation was higher than that in
Japan
More specifically, housing accounted for roughly one-fifth of total expenditures in
Japan
at 21%, lower than 13% in
Malaysia
.
In addition
, the percentages of other goods and services held the top rank in both two nations at 29% and 26%, respectively. Meanwhile, the proportion of food was lower at 27% in
Malaysia
, which was 3% higher than in
Japan
Regarding the remaining features, the averages for transport and health care were the lowest in
Malaysia
which took up 10% and 3%, respectively
while
the double was true for
Japan
Submitted by lamdactuanga on

Unauthorized use and/or duplication of this material without express and written permission from this site’s author and/or owner is strictly prohibited. Excerpts and links may be used, provided that full and clear credit is given to Writing9 with appropriate and specific direction to the original content.

Sentences: Add more complex sentences.
Linking words: Don't use the same linking words: "while".
Basic structure: Change the fourth paragraph.
Vocabulary: Replace the words malaysia, japan with synonyms.
Vocabulary: Only 6 basic words for charts were used.
Vocabulary: Use several vocabularies to present the data in the second paragraph.
Vocabulary: Use several vocabularies to present the data in the fourth paragraph.
What to do next:
Look at other essays: