The chart below gives information about Southand's main exports in 2000, 2020, and future projections for 2025. Summarise the information by selecting and reporting the main features, and make comparisons where relevant.

The chart below gives information about Southand's main exports in 2000, 2020, and future projections for 2025.

Summarise the information by selecting and reporting the main features, and make comparisons where relevant.
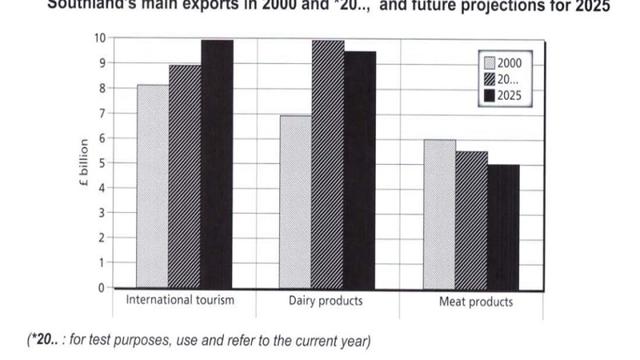
The graph demonstrates the amount of Southland's income from exporting 3
products
(International tourism, dairy
products
, and meat
products
). Data was taken in 2000 and 2023,
along with
its projection for 2025. In general, international tourism has been the most excellent of Southland’s exports
whereas
its lowest export is consistently in meat
products
.
Submitted by misstiasclassroom on

Unauthorized use and/or duplication of this material without express and written permission from this site’s author and/or owner is strictly prohibited. Excerpts and links may be used, provided that full and clear credit is given to Writing9 with appropriate and specific direction to the original content.

Introduction: The introduction is missing.
Introduction: Change the first sentence in the introduction.
Introduction: The chart intro is missing.
Basic structure: Write more paragraphs.
Basic structure: Add more body paragraphs.
Common mistake: Your writing should be 150-250 words.
Introduction: The chart intro is missing.
Basic structure: Write more paragraphs.
Vocabulary: Replace the words products with synonyms.
Vocabulary: Only 3 basic words for charts were used.
Vocabulary: Use several vocabularies to present the data in the second paragraph.
What to do next:
Look at other essays: