
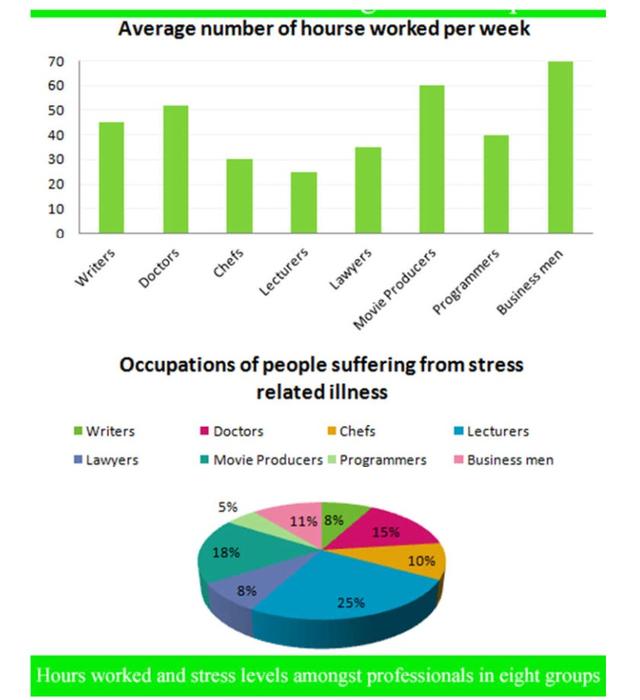
The bar graph explains data about working
hours
of eight different types of occupations Use synonyms
whereas
the pie chart presents the proportions of them suffering from stress-related problems.
Linking Words
Overall
, Linking Words
it is clear that
professionals who Linking Words
work
longer Use synonyms
hours
are businessmen Use synonyms
while
people who have high stress-related illnesses are teachers.
Linking Words
Furthermore
, in the first picture, businessmen Linking Words
work
70 Use synonyms
hours
,the highest among given professionals. The second highest is movie producers and they Use synonyms
work
60 Use synonyms
hours
in a given period. Doctors have the third longest working Use synonyms
hours
. Authors ,programmers, lawyers and chiefs are in the following stages.Their working Use synonyms
hours
are 47,40, 37,30. Use synonyms
In addition
, the least working Linking Words
hours
are for lecturers 28 Use synonyms
hours
a week.
Use synonyms
Moreover
, interestingly, educators Linking Words
work
fewer Use synonyms
hours
than other professionals .Use synonyms
Nevertheless
, their stress-related sickness is higher than others. Almost one-fourth of pedagogues have Linking Words
this
problem .Movie producers and doctors have 10 and 15 per cent of Linking Words
this
kind of issue. As regards the businessmen who Linking Words
work
longer Use synonyms
hours
per week ,their rate of Use synonyms
this
ailment is only 10 % . Programmers , writers, and lawyers suffer from Linking Words
this
issue approximately less than 10 %.Linking Words