
This
line chart illustrates, The Linking Words
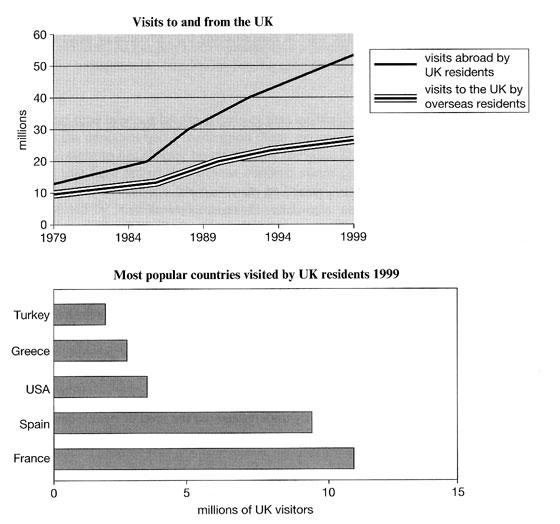
visitors
to and from the United Kingdom in a two-decade period between 1979 and 1999. Use synonyms
while
The bar chart depicts, The most nations that are visited by United Kingdom citizens. From an Linking Words
overall
perspective, By 1999 tourism by British residents increased sharply to become the highest of 55 Linking Words
million
people .
Regarding the line chart, In 1979 tourism by Use synonyms
a
foreign citizens to the UK began with 10 Correct the article-noun agreement
apply
million
Use synonyms
visitors
, Use synonyms
Then
, increased gradually until hit its peak in 1999 with 28 Linking Words
million
tourists.
Turning to the most preferred destination to the British, France comes in first place with 11 Use synonyms
million
Use synonyms
visitors
. The second in rank was Spain with 9 Use synonyms
million
tourists from Great Britain. Turkey was the least popular among UK residents with 3 Use synonyms
million
people in 1999. The USA and Greece had less than 5 Use synonyms
million
British Use synonyms
visitors
, Which were 4 and 3 Use synonyms
million
respectively.Use synonyms