
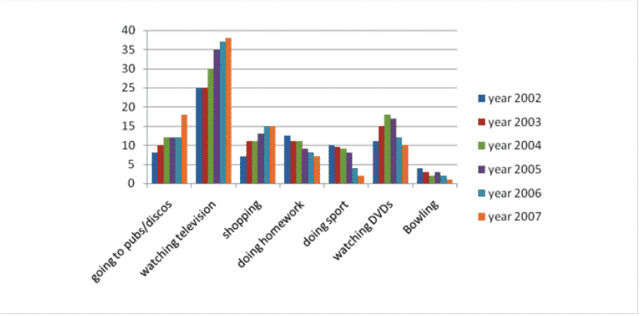
The bar chart visually illustrates the total duration of youngsters spent on various activities per week, which was counted in hours, in Chester between 2002 and 2007.
Overall
, watching television was the highest and generally increased over the years.
Watching television Linking Words
initially
started at 25, Linking Words
then
for the next few years, it kept increasing until around 37 in 2007. Linking Words
Also
for shopping, it stood at 5 in 2002 and grew to threefold in 2007. Going to pubs Linking Words
also
rose, it started at about 8 in 2002, Linking Words
then
it went up to nearly 12, and jumped to approximately 18.
Doing homework, Linking Words
on the other hand
, generally decreased. In the beginning, it was about 12 and continued to drop to half in 2007. Similar to the former, doing sport dropped and ended up being a small amount in 2007. Linking Words
Also
, bowling became smaller, Linking Words
this
category represented the smallest among all categories. Linking Words
Next,
watching DVDSs mostly dropped, Linking Words
although
it increased in the first 3 years, it dropped to smaller than the initial number in 2007.Linking Words