The pie charts below show how teenagers in Japan and Australia spent their money in 2019.

The pie charts below show how teenagers in Japan and Australia spent their money in 2019.
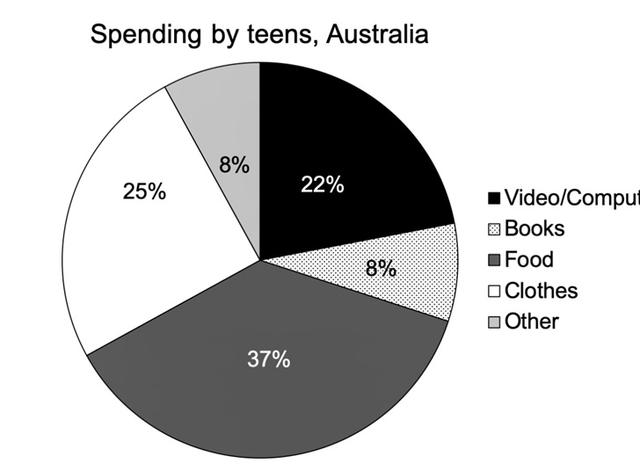
The provided pie chart illustrates the percentage of expenditure by different categories of youths in
Japan
and
Australia
in 2019.
Overall
, it can be clearly seen that the highest expense of youths in
Japan
and
Australia
was food. The least expenditure of adults in
Japan
and
Australia
was books and other.
To begin
with, the figure describes that the majority of spent money
in
Change preposition
by
show examples
adolescents was
food
Change preposition
on food
show examples
at 37%, followed by clothes at 25%, and videos/computers at 22%
respectively
Rephrase
apply
show examples
.
However
, young people in
Japan
and
Australia
spent money at least
for
Change preposition
on
show examples
books and food, both at 8%.
Submitted by alisa.chuaypalad on

Unauthorized use and/or duplication of this material without express and written permission from this site’s author and/or owner is strictly prohibited. Excerpts and links may be used, provided that full and clear credit is given to Writing9 with appropriate and specific direction to the original content.

Sentences: Add more complex sentences.
Common mistake: Your writing should be 150-250 words.
Vocabulary: Replace the words japan, australia with synonyms.
Vocabulary: Only 6 basic words for charts were used.
Vocabulary: Use several vocabularies to present the data in the second paragraph.
Topic Vocabulary:
  • spending habits
  • savings
  • electronic goods
  • physical goods
  • cultural differences
  • social media influence
  • advertising impact
  • education expenses
  • priority
  • trends
  • analysis
  • comparison
  • popularity
  • impact
  • expenses
  • categories
What to do next:
Look at other essays: