
The line graph compares the
production
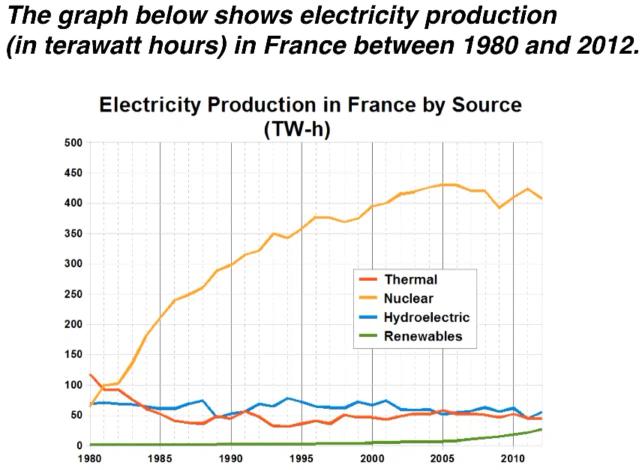
of electricity in France over the period of 32 years (1980 – 2012).
Use synonyms
Overall
, the amount of electricity produced from nuclear Linking Words
power
was highest Use synonyms
while
renewable energy Linking Words
production
was lowest.
The 1980 – Use synonyms
Use synonyms
production
of nuclear and hydroelectric Correct article usage
the production
power
Use synonyms
were
the same (about 70 Correct subject-verb agreement
was
terawatt
Use synonyms
hours
). In the same year, there were around 120 Use synonyms
terawatt
Use synonyms
hours
of thermal electricity was produced and renewables were not produced. 5 years later, nuclear energy increased sharply to about 200 and was the main resource in France.
Since 1985, nuclear Use synonyms
power
has grown constantly and reached Use synonyms
the
peak of 430 Correct article usage
a
terawatt
Use synonyms
hours
. Use synonyms
By contrast
, the figure for thermal Linking Words
power
declined to about 50 Use synonyms
terawatt
Use synonyms
hours
in 2012 and remained unchanged for the rest of the period. The number of renewables from 1980 to 2012 rose slightly. Use synonyms
This
period saw a minimal fall in hydroelectric Linking Words
power
Use synonyms
production
(from about 70 to 50 Use synonyms
terawatt
Use synonyms
hours
).Use synonyms