
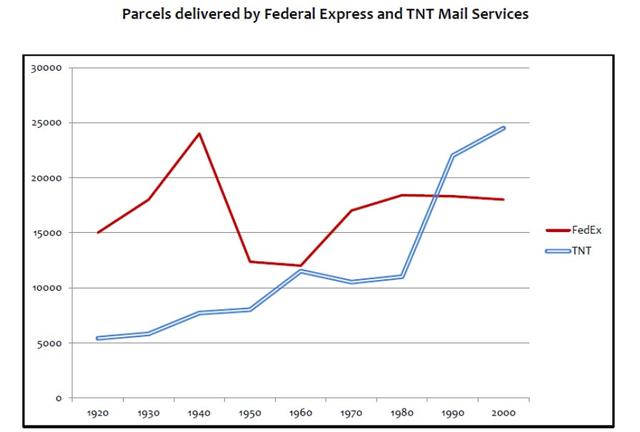
The graph shows how many parcels were delivered by two main companies ,namely TNT and
Fedex
between 1920 and 2000.
Use synonyms
Overall
, Linking Words
it is clear that
there were considerable increases in the number of parcels delivered by both companies .Linking Words
Additionally
, it is Linking Words
also
worth mentioning that TNT was the largest sector and the Linking Words
figure
overtook that of Use synonyms
FedEx
Use synonyms
at the end
,despite being the smallest point at the beginning.
Linking Words
Initially
, in 1920, Linking Words
FedEx
was the most dominant mail company in delivering parcels with 15.000. After rising sharply to 20.000 during the first 20 years,the Use synonyms
figure
fell briefly to around 12,500 in 1950.The Use synonyms
figure
, Use synonyms
however
, started to improve again with slight fluctuations and had reached well below 20.000 by the Linking Words
last
year.
Turning to the latter, the Linking Words
figure
was quite opposite to the tendency of the Use synonyms
Fedex
company .The Use synonyms
figure
for TNT stood out as the smallest sector ,Use synonyms
on the other hand
, accounted for 5.000 in the first year Linking Words
then
quintupled Linking Words
at the end
of the period before remaining stable at approximately 11.000 between 1960 and 1980.Linking Words