
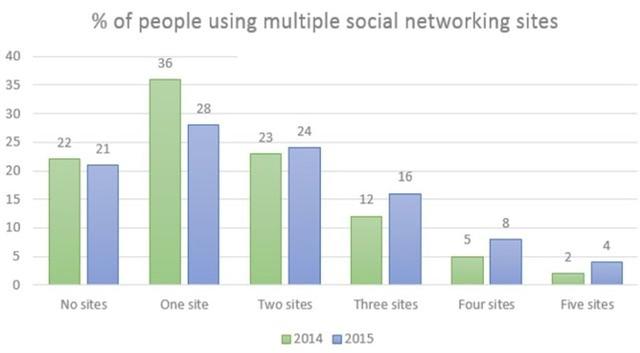
The bar graph
illtrates
the data in percentages about the individuals who Correct your spelling
illustrates
use
different social networks in Canada from 2014 to 2015. Wrong verb form
used
Overall
, it is evident that Linking Words
majority
of the Correct article usage
the majority
people
preferred using one site in both years Use synonyms
well
Rephrase
apply
as
members who used five social networks were the least.
It is clear from the graph that 36% and 28 % of Correct word choice
and
people
used one site in both years Use synonyms
hence
being the highly used network Linking Words
while
over twenty percent of individuals were unable to utilize any of the social networking. Linking Words
Furthermore
, the percentage of Linking Words
people
who utilized two sites in 2014 was less Use synonyms
by
1% than those of 2015.
In Change preposition
than
contract
, it is observed that only 12% of the Correct your spelling
contrast
people
enjoyed using three networks Use synonyms
however
, there was a growth of 4% by 2015. Linking Words
Moreover
, the percentage of individuals who participated in utilizing 4 sites to socialize in 2014 Linking Words
were
two times higher than those who Correct subject-verb agreement
was
evyed
five of them and only a small number liked more than 4 sites in 2014.Correct your spelling
eyed