
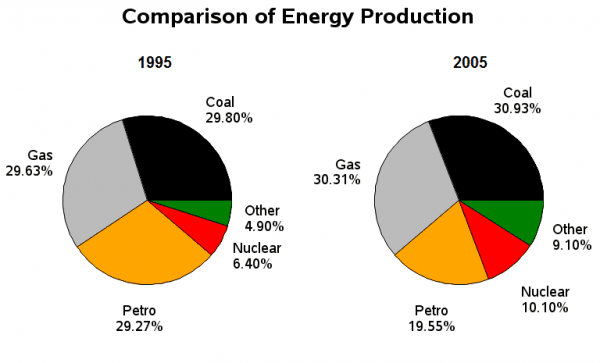
The supplied charts compare the proportion of different types of energy produced in France in two years, 1995 and 2005.
Overall
, as can be seen, gas and coal were the most significant by far in Linking Words
both
years. Use synonyms
In addition
, Linking Words
both
increased in dominance, whilst remaining the top in production in the succeeding year.
The three kinds that held the majority in 1995 were coal, petrol, and gas, which were 29.80%, 29.27%, and 29.63%, respectively. Whilst coal and gas increased their percentage to 30.93% and 30.31%, petrol saw a decrease to 19.55% in 2005. Use synonyms
Additionally
, all three categories obtained the highest position in the production of energy in Linking Words
both
periods.
The remaining two had around a tenth of the total in 1995 each, but Use synonyms
both
rose by around 5% in 2005. Of the smallest percentage, other sources moderately rose from 4.90% to 9.10%. Nuclear energy went from 6.40% to 10.10% in 2005.Use synonyms

