
The bar chart demonstrates the distribution of families' weekly
budget
in Fix the agreement mistake
budgets
a
different Correct article usage
apply
type
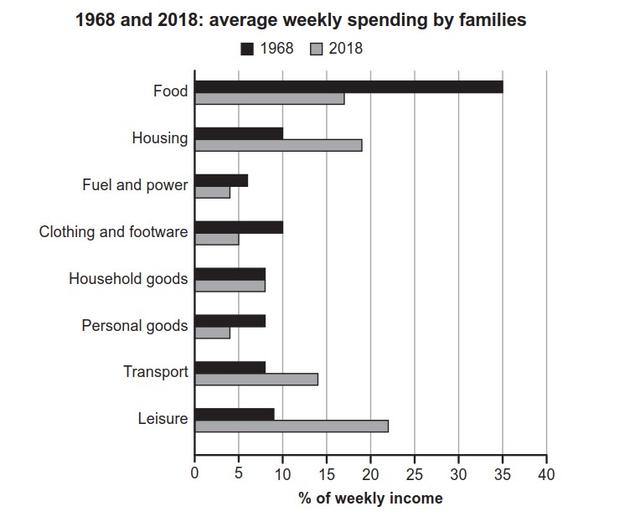
of areas in 1968 and in 2018. The data is in proportion.
Fix the agreement mistake
types
Overall
, Linking Words
while
the dominating expenditure was food in 1968, it changed to the leisure Linking Words
category
in 2018. Use synonyms
Additionally
, the least spending was on Linking Words
fuel
and Use synonyms
power
in 1968 and personal goods Use synonyms
in addition
to the Linking Words
fuel
and Use synonyms
power
in 2018.
In detail, the greatest spending was on the food Use synonyms
category
in 1968 with 40% and it is followed by the categories of housing, clothing and footwear both having 10%. The least consumption belongs to the Use synonyms
category
of Use synonyms
fuel
and Use synonyms
power
with nearly 6%. The food Use synonyms
category
is the only Use synonyms
category
which showed a markable decrease of nearly 17% in 2018.
Use synonyms
Moreover
, in 2018, the greatest expenditure was leisure Linking Words
category
with nearly 23% and Use synonyms
then
followed by housing and transport with nearly 19% and 14%, respectively. The least expenditure was Linking Words
fuel
and Use synonyms
power
and personal goods with the same proportion which is nearly 4%. Use synonyms
Lastly
, the only Linking Words
category
that remained steady was household goods. The share of spending did not change between the two years.Use synonyms