The first chart below shows how energy is used in an average Australian household. The second chart shows the greenhouse gas emissions which result from this energy use. Summarise the information by selecting and reporting the main features, and make comparisons where relevant.

The first chart below shows how energy is used in an average Australian household. The second chart shows the greenhouse gas emissions which result from this energy use.

Summarise the information by selecting and reporting the main features, and make comparisons where relevant.
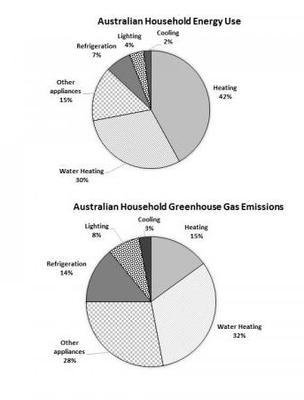
The pie charts illustrate the range of
energy
used in Australian households and the percentage of greenhouse gas
emissions
produced.
Overall
, the most used
energy
in Australia is heating, which has the smallest impact.
Conversely
, other
energy
such
as water heating, refrigeration, cooling, lighting, and other appliances had a bigger proportion of
emissions
than the total
energy
utilized. First of all, the majority of domestic use is 42% for heating. Surprisingly, it had the lowest pollution at 15%.
On the other hand
, the two different
energy
uses produce slightly greater
emissions
. Water heating is the second-highest Australian use at 30% with 32% of resulting
emissions
.
Then
, cooling is the lowest percentage used at 2% with 3% of pollution produced.
Furthermore
, the
energy
used for lighting, refrigeration, and other appliances had double the
emissions
than the average consumed. Lighting is used by 4% and produces pollution up to 8%, followed by refrigeration used at 7% with 14% of
emissions
, and other appliances consumed by 15% with 28% of resulting
emissions
.
Submitted by ru.kabiru.biru on

Unauthorized use and/or duplication of this material without express and written permission from this site’s author and/or owner is strictly prohibited. Excerpts and links may be used, provided that full and clear credit is given to Writing9 with appropriate and specific direction to the original content.

Basic structure: Change the fourth paragraph.
Vocabulary: Replace the words energy, emissions with synonyms.
Vocabulary: Only 5 basic words for charts were used.
Vocabulary: The word "percentage" was used 2 times.
Vocabulary: Use several vocabularies to present the data in the fourth paragraph.
Topic Vocabulary:
  • Average Australian household
  • Greenhouse gas emissions
  • Energy consumption
  • Activities
  • Heating
  • Cooling
  • Water heating
  • Appliances
  • Lighting
  • Standby
  • Percentage (%)
  • Consumption patterns
  • Efficiency
  • Emissions impact
  • Renewable energy
  • Energy-saving measures
  • Sustainability
  • Carbon footprint
  • Electricity
  • Natural gas
  • Emissions breakdown
  • Energy audit
  • Environmental impact
  • Conservation
  • Mitigation strategies
What to do next:
Look at other essays: