
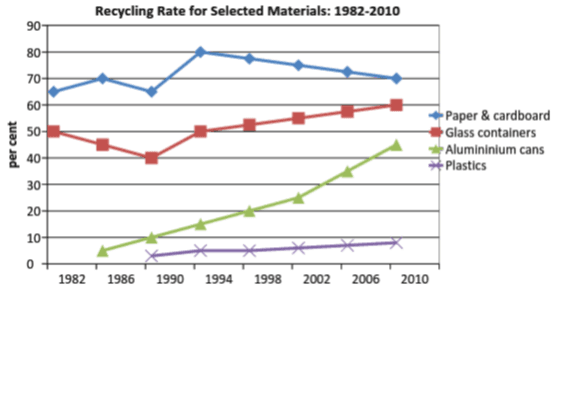
The line chart provided illustrates the percentage of four selected materials recycled in a country from 1982 to 2010. Generally, paper and cardboard had the highest proportion throughout the
period
, Use synonyms
while
plastics took the reverse.
To commence with, paper and cardboard were the most recyclable materials all over the Linking Words
period
. They got the highest percentage from the beginning (65%) in 1982 to the end (70%) in 2010. Use synonyms
However
, plastics began to be recycled in 1990 and they took the lowest proportion consistently with under 10% Linking Words
since
1990 until 2010.
Change preposition
from
Moreover
, glass containers were in the second place of recyclable materials between 1982 and 2010. They had 50% in Linking Words
initial
and Correct article usage
the initial
got
the peak Verb problem
reached
with
60% Change preposition
of
at the end
of the Linking Words
period
. Use synonyms
Additionally
, the recycling rate of aluminium cans sharply increased throughout the Linking Words
period
. They served the lowest start at 5% in 1986 and finished at their Use synonyms
peaks
at 45% in 2010.Fix the agreement mistake
peak