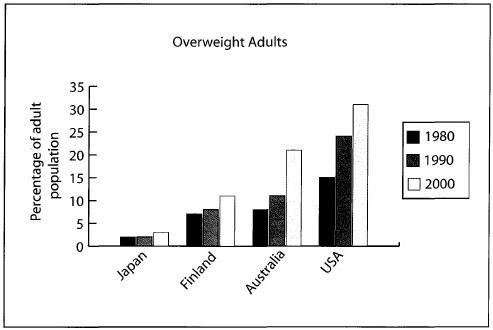
IELTS Writing Task Chart for The chart below gives Information about the percentage of the adult population who were overweight in four different countries in 1980, 1990 and 2000.
Unauthorized use and/or duplication of this material without express and written permission from this site's author and/or owner is strictly prohibited. Excerpts and links may be used, provided that full and clear credit is given to Writing9 with appropriate and specific direction to the original content.
Sentences: Add more complex sentences.
▼
Linking words: Add some linking words.
▼
Linking words: Add linking words.
▼
Introduction: The introduction is missing.
▼
Introduction: Change the first sentence in the introduction.
▼
Introduction: The chart intro is missing.
▼
Basic structure: Write more paragraphs.
▼
Basic structure: Add more body paragraphs.
▼
Common mistake: Your writing should be 150-250 words.
Introduction: The chart intro is missing.
▼
Basic structure: Write more paragraphs.
▼
Vocabulary: Only 4 basic words for charts were used.
There is no denying the fact that The threat of nuclear weapons keeps our planet and world peaceful. Also, nuclear power provides many benefits such as this power is cheap and clean energy. There is also an argument that opposes it. In my opinion, I consider that the advantages of nuclear technology outweigh the disadvantages.
The significance of education has been highlighted over the past decades. From this aspect, questions about whether educating young people is naturally essential, However, some think the authorities ought to invest more in education for adults in need arise. In my opinion, governments ought to invest more in education for the youth to some extent.
Improving people’s lives is always a controversial problem. There is a belief that the purpose of science is to develop the human’s life. The writer of this essay agrees with this notion that it not only reduces wasting time but also acquires a lot of goals in various fields.
In the contemporary era, many stationery for handwriting such as a pen, pencil or brush tend to be less used. From my perspective, this tendency can be explained by the development of digital devices and people’s demand for convenience. Along with this ,I believe that the downward trend of writing by hand can bring beneficial improvement, especially in education.
In this day and age, planning for the future is always a hotly debated topic. When talking about plans for the future, people often discuss jobs, relationships or studies. Some individuals believe that everyone, including young people saving money is very crucial for their future. In my point of view, I totally agree with this statement. The following essay will indicate my opinion.