
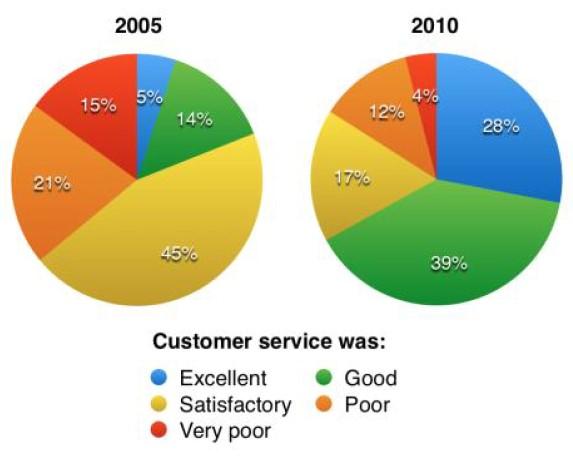
The pie charts compare the ratings of different customer services of Parkway Hotel between 2005 and 2010.
Overall
, though the very poor work was considerable in 2005, it fell in 2010. Linking Words
On the other hand
, good duty increased dramatically in 2010. Linking Words
Although
the satisfactory was the highest in 2005, it was replaced by good in 2010.
Looking at the details, excellent assistance grew from 5% in 2005 to 28% in 2010, which was more than five times in 2005. Linking Words
However
, there was about three times as much good supply in 2010 as in 2005. The percentages are 39% and 14% respectively.
Linking Words
In contrast
, Poor and satisfactory services both declined significantly. Poor duty shrank to almost half at 12% from 21% and the satisfactory level decreased from 45% to 17%. Very poor duty plummeted to one-fourth in 2010 from 15% in 2005.
In conclusion, it can be figured out from the graph that there was a positive change in business from 2005 to 2010.Linking Words