
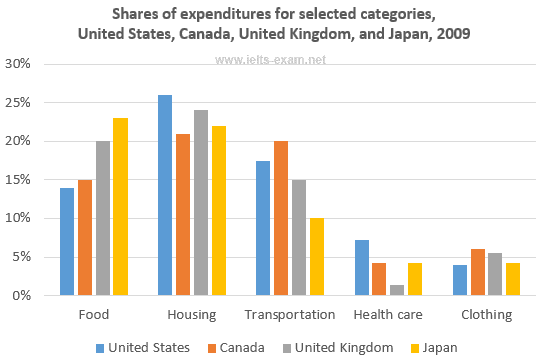
The given bar chart illustrates the expenditure structure of residents in the US, Canada, the UK, and Japan, which included 5 classifications in 2009.
Overall
, in all aforementioned areas, food, accommodation, and transportation expenses were dramatically high, with accommodation leading the way. When it comes to the 2 left categories, the pattern was radically reversed.
The cost of accommodation shared more than a quarter of Americans’ income and over 20% in other countries. Linking Words
While
Linking Words
this
was the highest ratio in the Western countries, nourishment cost the most in Japan at well under 25%. In comparison, it was paid the least by the US citizens at approximately 14% of their income. It was Linking Words
also
worth noticing that Canadians spent the same amount on houses and commuting; meanwhile, the percentage of the Japanese spending on transportation was 10%, being the lowest among the 5 areas.
Regarding garments and medical fees, Americans tended to spend only about 2% of their total income on the latter, being the lowest figure to be examined. To compare, the other nations spent the least money buying clothes, which accounted for around 5% of their salaries.Linking Words