
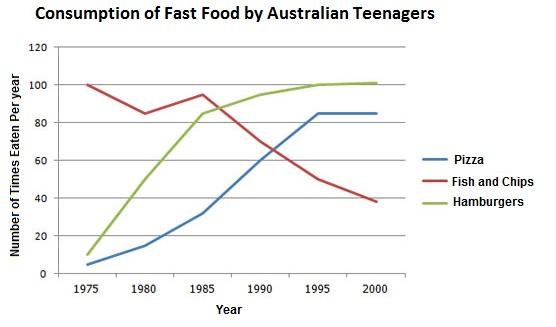
The line chart describes information about the junk food eaten by Australian teenagers throughout the period from 1975 to 2000. Units are measured in numbers of time.
Overall
, Linking Words
it is clear that
the consumption of fish and chips was a dominant slash at the beginning of the period in spite of declining Linking Words
at the end
of the duration. Linking Words
Furthermore
, the eating of hamburgers was a dramatic increase over the 25 years. Linking Words
Moreover
, it is worth noting that pizza was a significant change in consumption.
Linking Words
In particular
, it can be seen that Linking Words
although
fish and chips were a leader, there was witnessed a sharp fall. Linking Words
Firstly
, it reduced to roughly 80 in 1980 despite being 90 in 1985. Following that, there was a substantial decrease to 40 till 2000.
Plausible as Linking Words
this
seems, Linking Words
initially
, in 1975, the eating of hamburgers represented one of the lowest points,afterwards it went up dramatically to nearly 85 in 1985. Linking Words
However
, it lost a noticeable growth and reached fractionally to 100. Linking Words
Whereas
, it took over leadership in 2000.
Regarding eating pizza which saw a marked rise and climbed to around 80. Linking Words
Besides
that, it remained unchanged from 1995 to 2000.Linking Words
Last
but not least, the consumption of hamburgers jumped to second position in 2000.Linking Words