
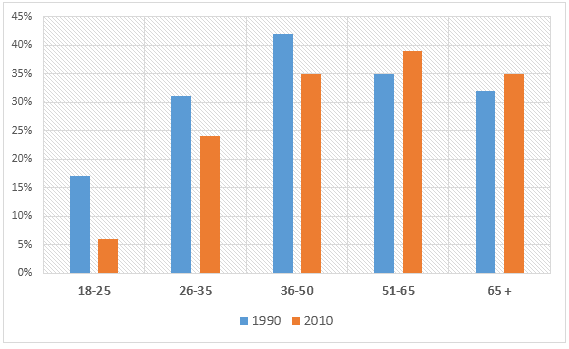
The bar chart illustrates the percentage of people in five different age groups in Britain who gave money to charity over a period of twenty years, from 1990 to 2010.
Overall
, fewer British people donated to charity, except for those who were above 50. It can Linking Words
also
be seen that people under 25 gave away the least, Linking Words
while
older citizens donated more to philanthropic causes than younger generations.
In 1990, citizens aged 36-50 contributed the most to charity, at around 45%. Linking Words
However
, Linking Words
this
figure decreased to only 35% in 2010. Linking Words
Similarly
, the 26-35 age group Linking Words
also
witnessed a 7% drop, from 31% to just under a quarter. The most significant decline can be found in the youngest age group (18-25), which plummeted from 17% to only about 7% two decades later.
Linking Words
In contrast
, the figures for older donors experienced a minimal upward trend over the same period. To be more specific, the percentage of donors in the 51-65 and above 65 groups rose by 2% and 3% respectively, reaching around 39% and 32% in 2010.Linking Words