
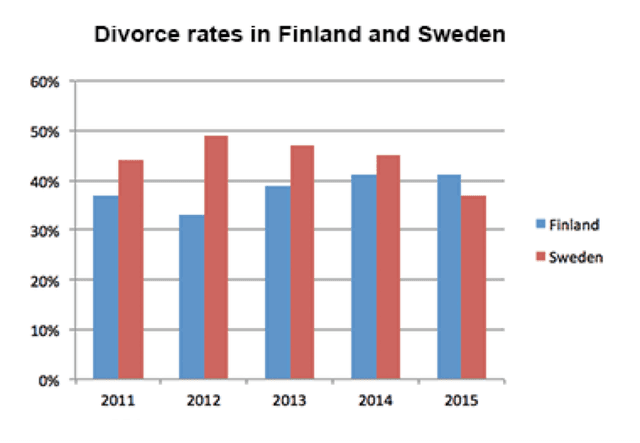
The bar graph represents the percentages of
divorce
in Use synonyms
Finland
and Use synonyms
Sweden
from 2011 to 2015. Use synonyms
Overall
, the proportion of Linking Words
Use synonyms
divorce
in Fix the agreement mistake
divorces
Finland
saw a slight increase Use synonyms
while
the Linking Words
divorce
Use synonyms
rate
in Use synonyms
Sweden
demonstrated a minor decrease after the period of five years.
In 2011 around 36% of the marriages ended in Use synonyms
Finland
before falling to about a third in 2012. Use synonyms
This
climbed gradually to just over %40 over the next two years and Linking Words
then
stayed relatively constant at Linking Words
this
level in 2015, demonstrating a higher Linking Words
divorce
Use synonyms
rate
than Use synonyms
Sweden
's value first time Use synonyms
at the end
of the period.
The proportion of Swedish Linking Words
divorce
Use synonyms
rate
was approximately 45% Use synonyms
in
the beginning of the period and Change the preposition
at
then
increased nearly Linking Words
a
half of the marriages after a year. In 2012 the proportion gap between Correct article usage
apply
Sweden
's and Use synonyms
Finland
's value was almost 20% which was the highest. Use synonyms
Sweden
's Use synonyms
divorce
Use synonyms
rate
declined moderately to just below 40% over the three years.Use synonyms