
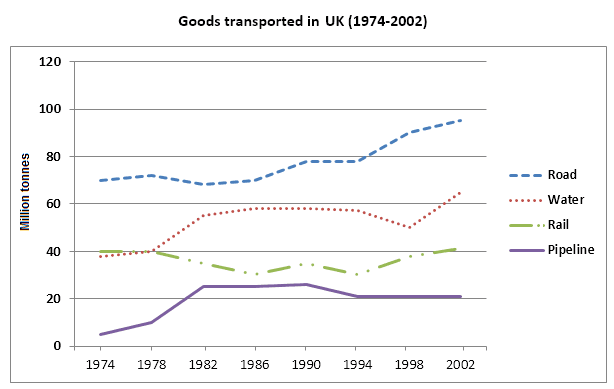
The line chart
illutrates
the Correct your spelling
illustrates
amount
of products transported in the UK by 4 various types of transport from 1974 to 2002. It is measured Use synonyms
by
Change preposition
in
million
Use synonyms
tonnes
.
Use synonyms
Overall
, road Linking Words
amount
was the highest Use synonyms
million
Use synonyms
tonnes
among other categories, Use synonyms
while
pipeline unit was less value in the following years. Linking Words
Rail
Use synonyms
quatities
and Correct your spelling
quantities
qualities
water
quantities fluctuated during the period.
As can be seen from the line chart, road Use synonyms
amount
started at nearly 70 Use synonyms
million
Use synonyms
tonnes
in 1974, it saw a slight increase in 1990, Use synonyms
whereas
it reached a peak ,Linking Words
approximately
90 Change preposition
of approximately
million
Use synonyms
tonnes
in 2002. Use synonyms
Pipeline
Correct article usage
The pipeline
amount
was 5 Use synonyms
million
Use synonyms
tonnes
in 1974 and it rocketed Use synonyms
just
over 20 in 1982, Change preposition
to just
while
it stood at Linking Words
same
level until 1990, Add an article
the same
then
decreased slowly in 1994. From 1994 to 2002 the pipeline Linking Words
amount
Use synonyms
contain
20 Change the verb form
contains
million
Use synonyms
tonnes
.
Use synonyms
On the other hand
, looking at more details in the figure, Linking Words
water
and Use synonyms
rail
Use synonyms
amount
started at nearly 40 Use synonyms
million
Use synonyms
tonnes
in 1974. Use synonyms
Use synonyms
Water
Correct article usage
The water
amount
witnessed a rise, as Use synonyms
rail
Use synonyms
experineced
a fall Correct your spelling
experienced
dramaticly
. Correct your spelling
dramatically
Rail
Use synonyms
amount
fluctuated between 1986 Use synonyms
abd
1994, Correct your spelling
and
then
it jumped Linking Words
just
over 40 Change preposition
to just
million
Use synonyms
tonnes
in 2002. During the period from 1982 to 194 Use synonyms
water
saw Use synonyms
Correct article usage
an increased
increased
significantly. In 1998, Replace the word
increase
Use synonyms
water
Correct article usage
the water
amount
dropped slowly, after it rose in 2002.Use synonyms