
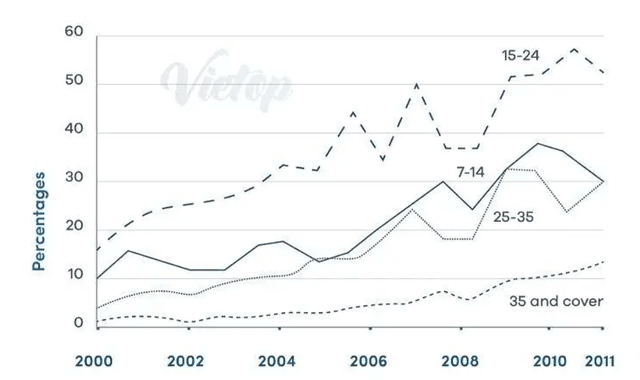
The line graph provides information about the average
attendance
at cinema among various Use synonyms
age
groups in the United America from 2000 to 2011.
Use synonyms
Overall
, the trend of average Linking Words
attendance
increased from 2000 to 2010. The Use synonyms
age
Use synonyms
group
15-24 experienced a significant Use synonyms
increase
, meanwhile, the Use synonyms
age
Use synonyms
group
of 35 and over showed the least Use synonyms
increase
.
The average Use synonyms
attendance
for the 15-24 Use synonyms
age
category increased gradually from 15% to 32% between 2000 and 2004, Use synonyms
then
fluctuated from 2006 (45%) to 2011 (52%). And reached a peak of 58% between 2010 and 2011.
Meanwhile, in the 7-14 Linking Words
age
category, the average Use synonyms
attendance
fluctuated from 2000 (10%) to 2005 (15%), and rose rapidly from 15% in 2005 to 30% in 2008. Use synonyms
This
Linking Words
group
reached the same value of 15% as the Use synonyms
age
of 25-35. The 25-35 Use synonyms
age
category experienced a gradual Use synonyms
increase
from 5% in 2000 to almost 30% in 2008, reaching its peak at 38% in 2010.
In more detail, the Use synonyms
age
Use synonyms
group
35 and over showed a stable Use synonyms
increase
during the given period from 2% in 2000 to 15% in 2011.Use synonyms