
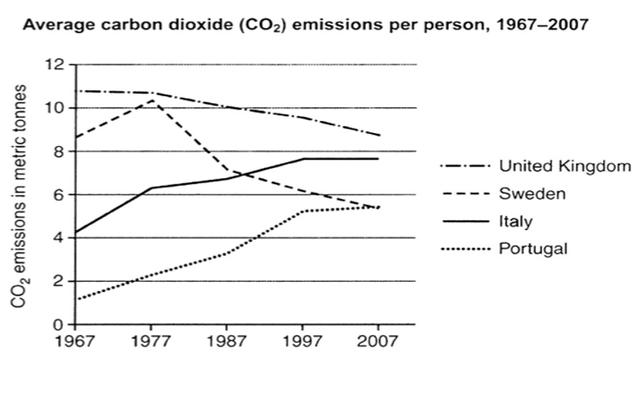
The line chart illustrates the average carbon dioxide (CO2) release per capita in four European countries over a period of four decades (1967–2007).
Overall
, it is clearly observable that UK residents produced the largest amount of CO2 over the entire period, Linking Words
whereas
people who were living in Portugal produced the least amount of Linking Words
this
gas.
In 1967, the figure for CO2 emissions by UK residents was nearly 11 metric Linking Words
tonnes
, Use synonyms
while
these figures for Portuguese and Italian were lower at approximately 1.5 metric Linking Words
tonnes
and just over 4 metric Use synonyms
tonnes
, respectively. From Use synonyms
this
year until 2007, the CO2 emissions by Linking Words
British
saw a moderate decrease of 2 metric Correct article usage
the British
tonnes
. Use synonyms
By contrast
, the amount of CO2 that was generated by Italian and Portuguese people grew to well under 8 and 6 metric Linking Words
tonnes
, respectively.
Use synonyms
On the other hand
, the average emissions by individuals who had been living in Sweden experienced a pivotal point, transitioning from an uptrend to a downtrend in 1977. From 1967 to 1977, Linking Words
this
figure rose from nearly 9 to just over 10 metric Linking Words
tonnes
, after which, until 2007, it fell markedly by around 4.5 metric Use synonyms
tonnes
.Use synonyms