The bar chart below shows the number of overseas students enrolled in a second year Graphic Design course at a college in the south of England. Write a report for a university lecturer describing the information shown.

The bar chart below shows the number of overseas students enrolled in a second year Graphic Design course at a college in the south of England.

Write a report for a university lecturer describing the information shown.
The line chart illustrates the reported amount of abroad
students
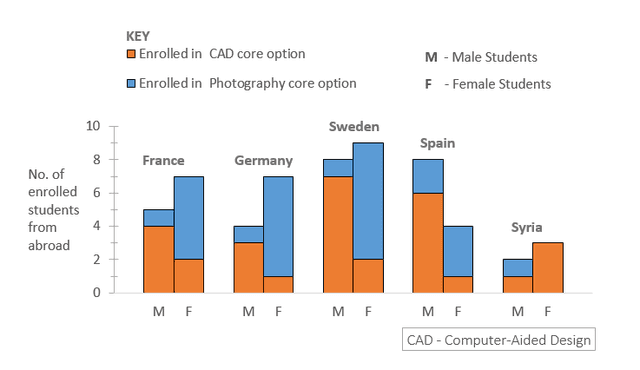
entering the second-year graphic design course at one of the colleges in the south of England. The bar chart describes the number of enrolled
students
from five different countries. There are two different colours of bars indicating the different categories. Blue indicates a student who takes the photography core option major and orange represents
students
enrolled in the CAD core option, CAD itself means Computer-Aided-Design. The graphic
also
divides the data into two categories based on gender. According
from
Change preposition
to
show examples
the graphic, we can conclude that Sweden has the most
students
enrolled
to
Change preposition
on
show examples
the colleges compared to the rest country mentioned in the data,
meanwhile
Add a comma
meanwhile,
show examples
Syria
is has
Change the verb form
has
show examples
the least enrolled
student
Fix the agreement mistake
students
show examples
from the shown-information.
Nevertheless
, Syria has the most female
students
enrolled in CAD core options.
On the other hand
Submitted by ieltswriting91 on

Unauthorized use and/or duplication of this material without express and written permission from this site’s author and/or owner is strictly prohibited. Excerpts and links may be used, provided that full and clear credit is given to Writing9 with appropriate and specific direction to the original content.

Sentences: Add more complex sentences.
Common mistake: Your writing should be 150-250 words.
Vocabulary: Replace the words students with synonyms.
Vocabulary: The word "chart" was used 2 times.
Vocabulary: The word "data" was used 2 times.
Topic Vocabulary:
  • bar chart
  • overseas students
  • enrolled
  • Graphic Design course
  • trends
  • fluctuations
  • steady increase/decrease
  • significant
  • minor changes
  • enrollment
  • popular
  • diverse nationalities
  • academic year
  • compared to
  • dominate
  • in contrast
  • percentage
  • proportion
  • visual representation
What to do next:
Look at other essays: