
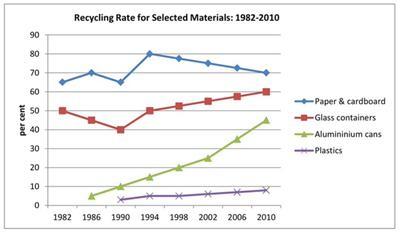
The line graph displays the amount of recycling in
percent
for diverse materials from 1982 to 2010 in a certain country.
Change the spelling
per cent
Overall
, the recycling of four materials saw different trends in the time period. Two materials showed some fluctuations, Linking Words
while
the others experienced increases.
The recycling of paper and cardboard started at approximately 65% in 1982. Linking Words
Afterward
, it changed frequently to 70% in 1986 and 65% in 1990. Change the spelling
Afterwards
This
number reached a peak of 80% in 1994. Linking Words
However
, it Linking Words
subsequently
decreased until it fell to 70% in 2010. The number of glass containers recycling, which started at 50%, Linking Words
also
grew with some oscillations. It dropped to 40% in 1990Linking Words
,
but later rose to 50% in 1994. Remove the comma
apply
This
figure continued to increase slightly until it ended at 60% in 2010.
Linking Words
On the other hand
, the figure of recycled aluminium cans witnessed growth over time. Linking Words
This
number started at roughly 4% in 1986. Linking Words
Then
, it surged continuously until it finished at 45% in 2010. Meanwhile, the percentage of plastics recycling went through small growth from around 3% in 1990 to only about 9% in 2010.Linking Words