
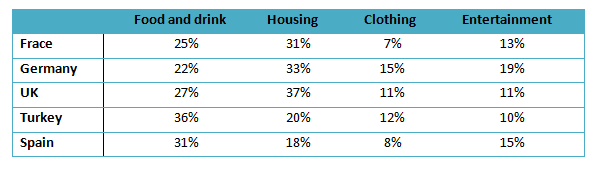
The table shows how five European states manage their household income on diets, housing, clothing, and entertainment.
Overall
, housing has become the first priority of France, Germany, and the UK when spending their monthly household income. Linking Words
However
, in Turkey and Spain, food and drink dominate the percentages. Linking Words
Furthermore
, the garment has become the least thing to spend in four out of five countries.
The highest spending on housing comes from the UK by 37%, Linking Words
then
Germany by 33%, and France by 31%. These three countries Linking Words
also
have the same similarity to other spending with priorities from food and drink, entertainment, and clothing. As the least preferred, clothing expenditure is only 11% for UK citizens 15% for Germans, and 7% for the French.
Linking Words
On the contrary
, for Turkey and Spain, the proportion of dietary is the highest with respectively 36% and 31%, making housing their second biggest expense. Linking Words
Although
clothing still became the lowest expenditure for Spanish with 8%, it is different for Turkish. In Turkey, entertainment constitutes 10% of the total percentage, making it the lowest-spending category.Linking Words