
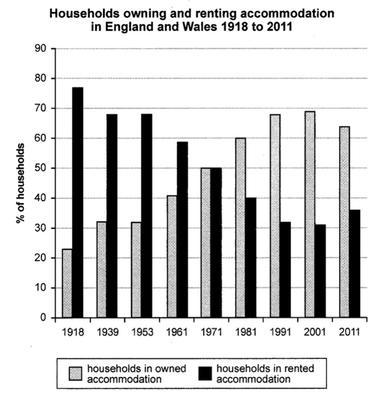
The line chart illustrates the ratio of households' temporary and permanent residence in two regions from 1918 to 2011.
Overall
, it can be seen that both statuses of ownership of the house had fluctuated. The number of people who bought their place continued to increase, Linking Words
while
those who rented keep decreased, except Linking Words
at the end
of the period.
People who lived in their residences increased slightly from about 20% to 50% between 1918 and 1971. It continued to rise significantly at almost 70% for 30 years later. Linking Words
However
, it has dropped to about 60% in 2011.
In comparison, at the beginning of the period, the households had the highest total rented houses at almost 80%, inversely related to permanent houses. Linking Words
Then
, it declined to about 68% in 1939 and 1963, about 59% in 1961. Ten years later, in 1971, those households had the same level proportion of 50%. It continued to fall drastically to 30% in 2011 and grew marginally above 30% in the Linking Words
last
period.Linking Words