
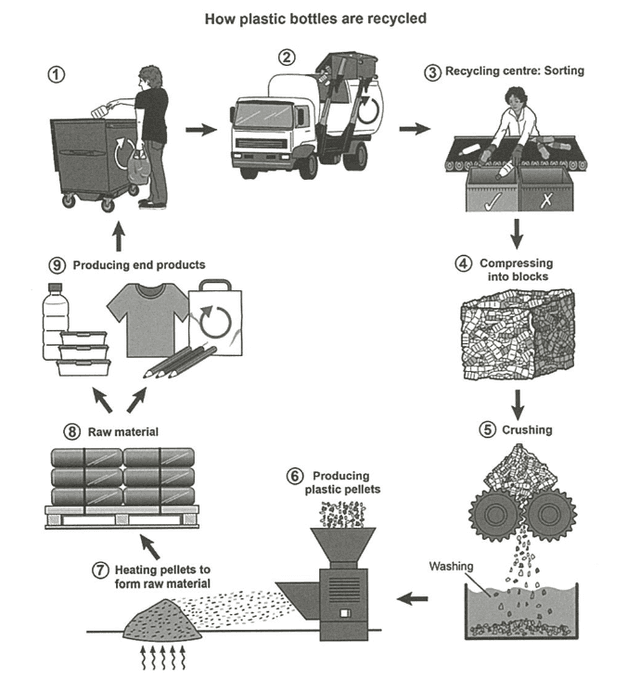
The diagram illustrates how plastic pottles are ready for recycling.
Overall
, it can be seen thatLinking Words
,
the process contains 9 stages, which start by dropping the bottles in the trash and it is ready for repeated recycling by producing some of the necessary products.
Remove the comma
apply
According to
the first step of the process, people drop some useless or second-hand Linking Words
production
in the trash. Replace the word
products
Next,
a special machine Linking Words
is gathered
all of them for the manufacturer. In the third stage, some persons have sorted Wrong verb form
gathers
this
production for the easier pack which is called the recycling centre, following which these productions are packed and compressed into blocks in a square shape which are ready for crushed by 2 big cyclers for washing them. Linking Words
Then
, these materials are moved to produce plastic pellets, resulting in formed heating pellets. In the penultimate step, the raw material is bagged into 6 big packages. Eventually, they are consumed by citizens and by putting these products into the trash, the cycle will be repeated for another round.Linking Words